 MaizeNetome
MaizeNetome
MaizeNetome
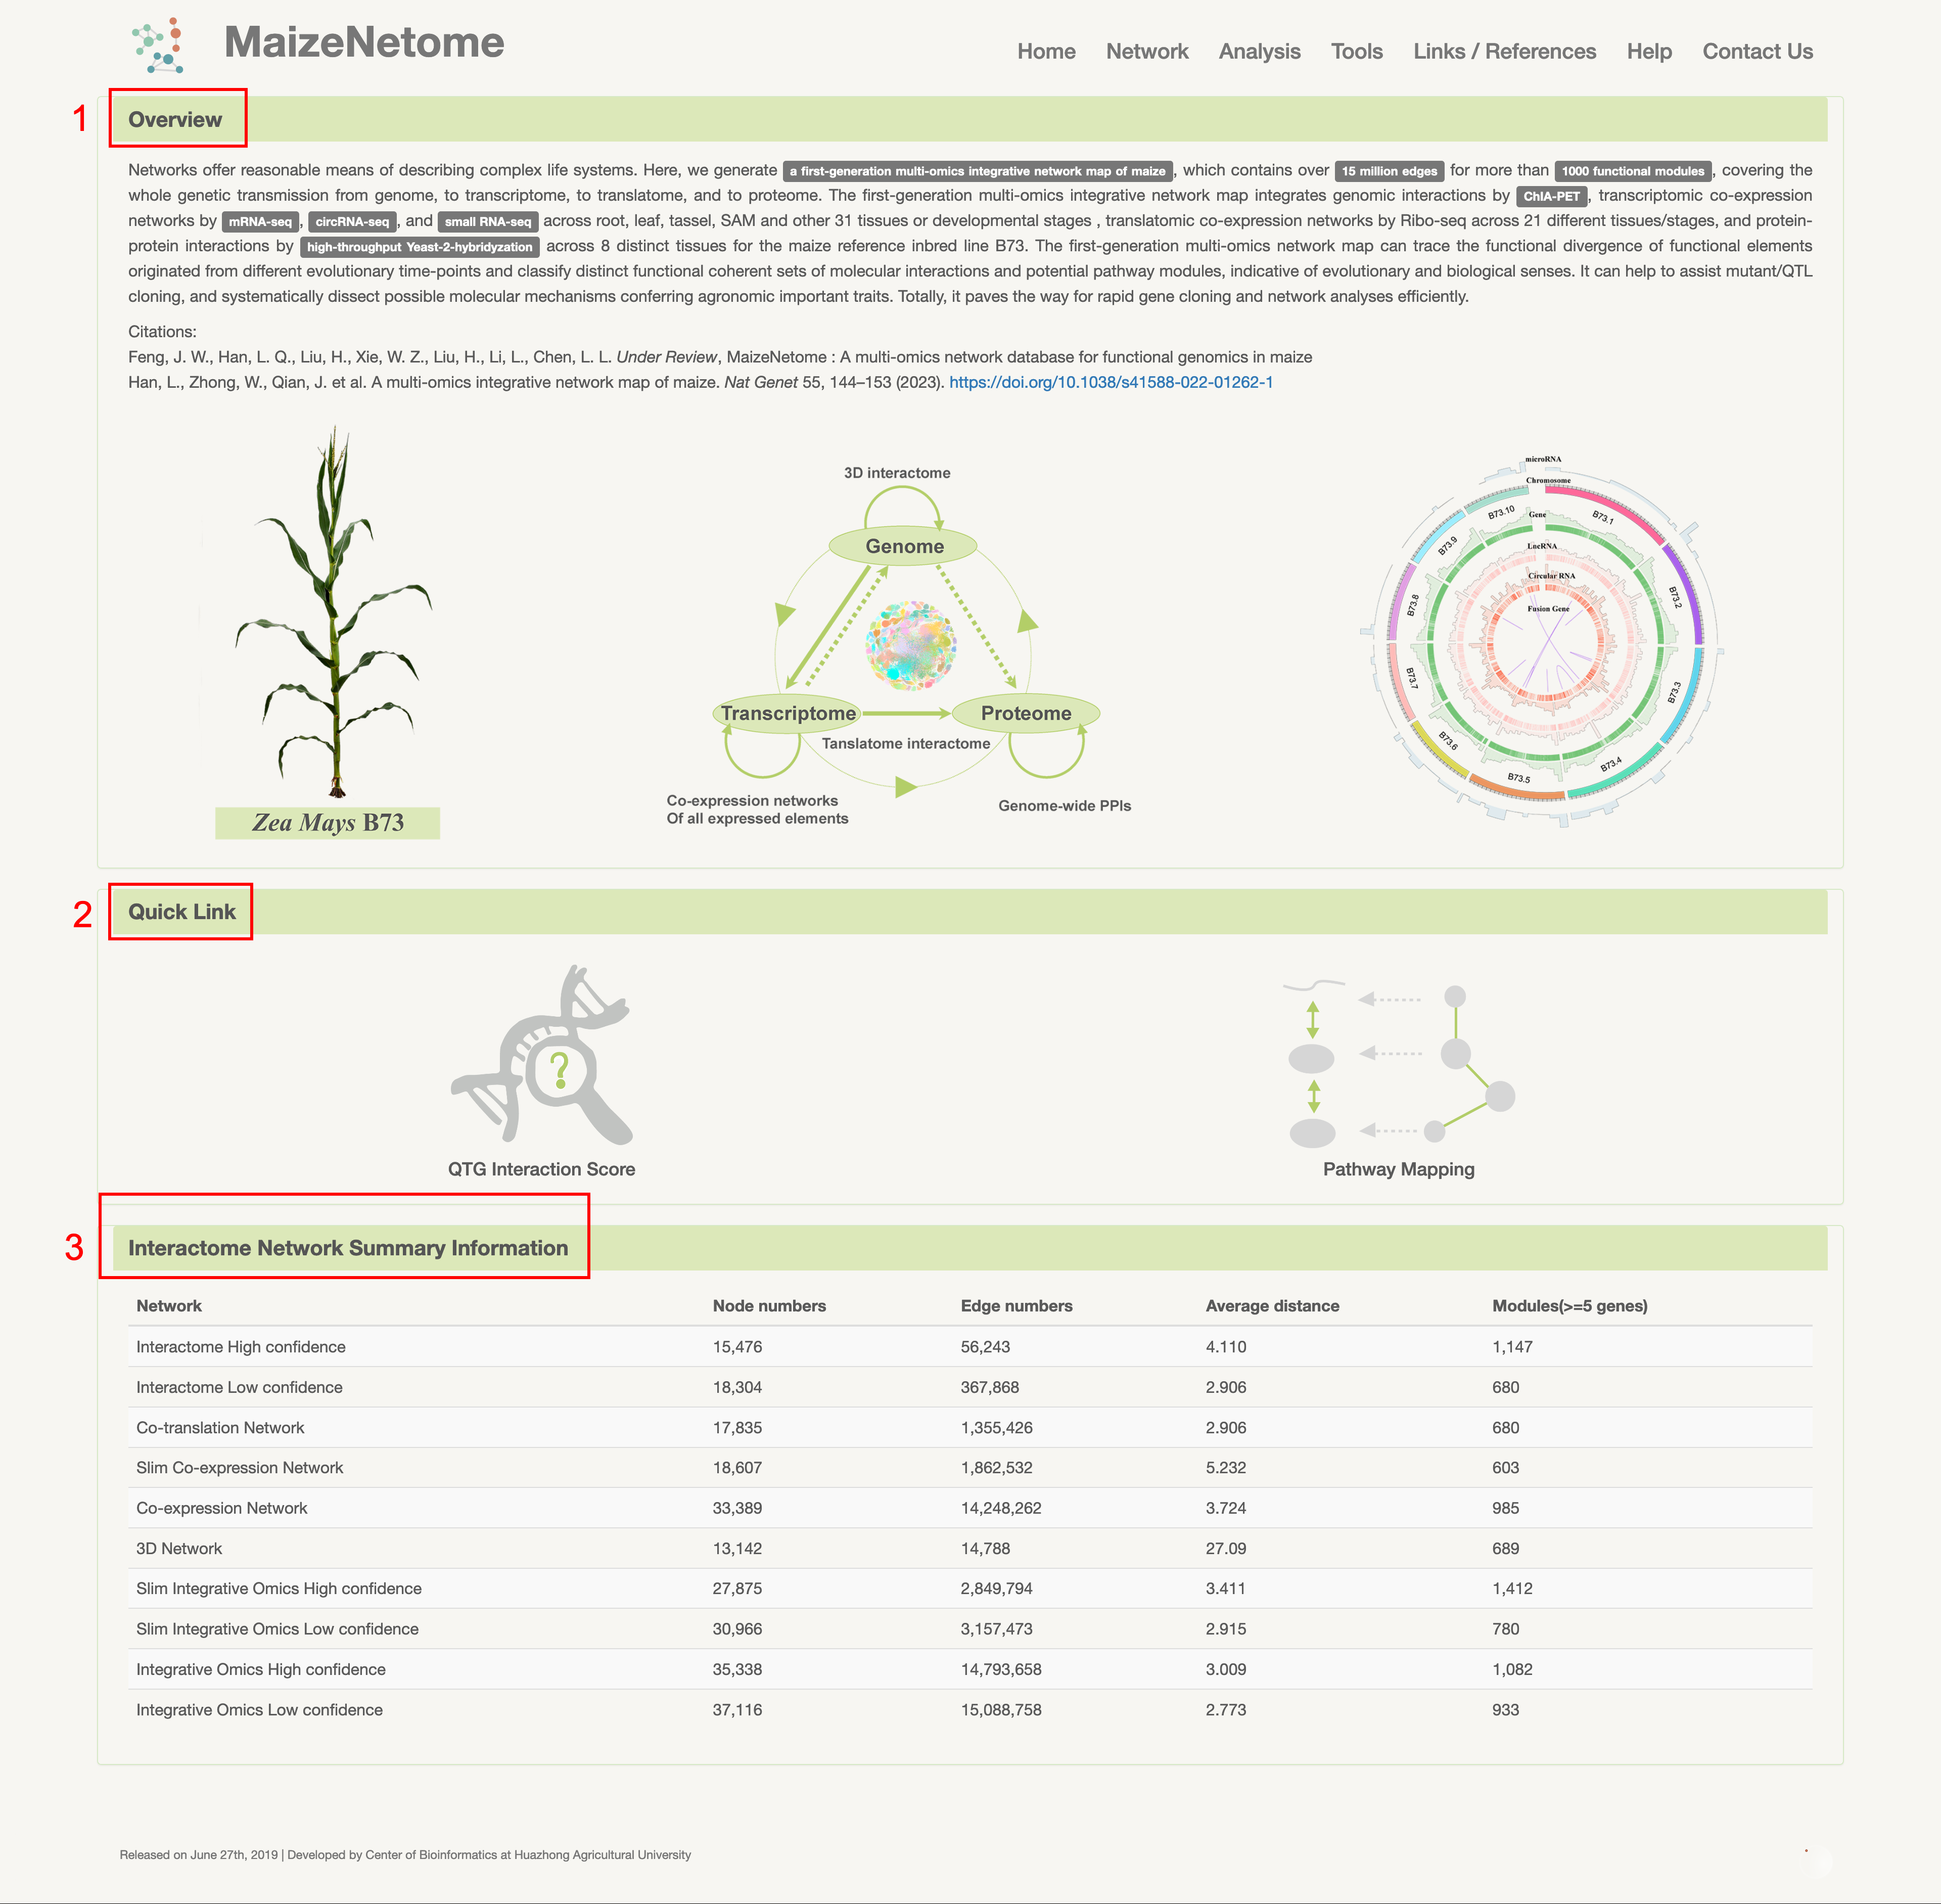
The home page has three sections: 1. An overview of the database; 2. The quick link to important functions; 3. The Interactome Network Summary Information.
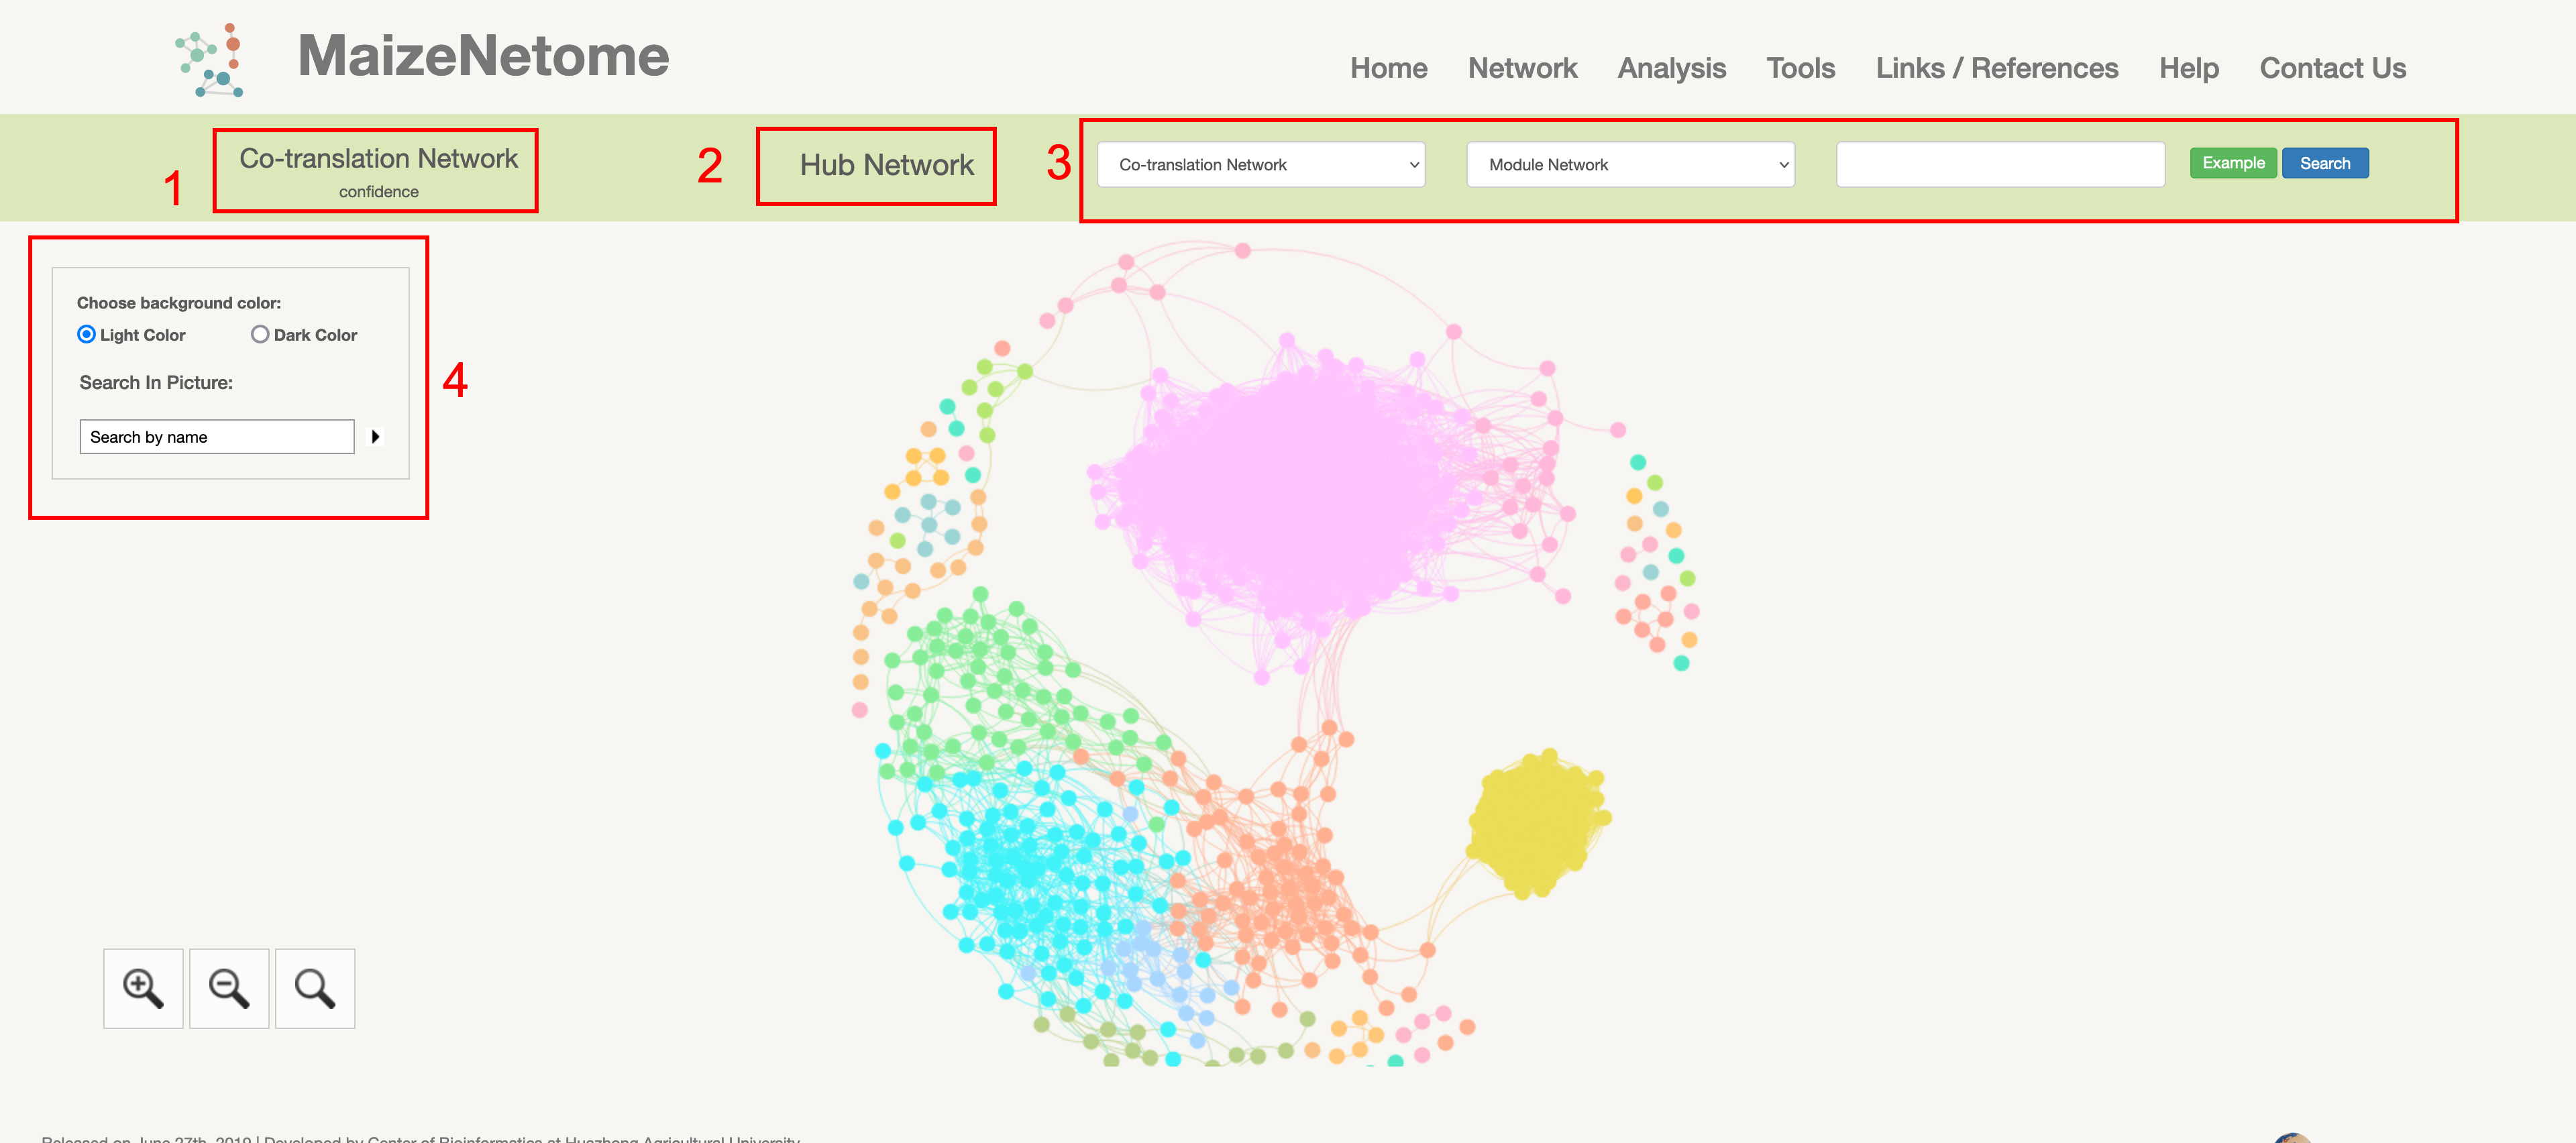
We design different levels of networks to display our data. Firstly, according to the user usage, it is divided into three types: Hub Network, Directly Connected Network, and Module Network. Users utilize them to access the different levels of data. Secondly, based on the data source, the network can be divided into 3D Network, Co-expression Network, Co-translation Network, Interactome, and Integrative Omics Network. The Co-expression Network and Integrative Omics Network could separate into complete networks, slim networks (based on B73V4 annotation). In addition, each network has different confidence levels (high and low). In short, we built 10 networks based on the above content.
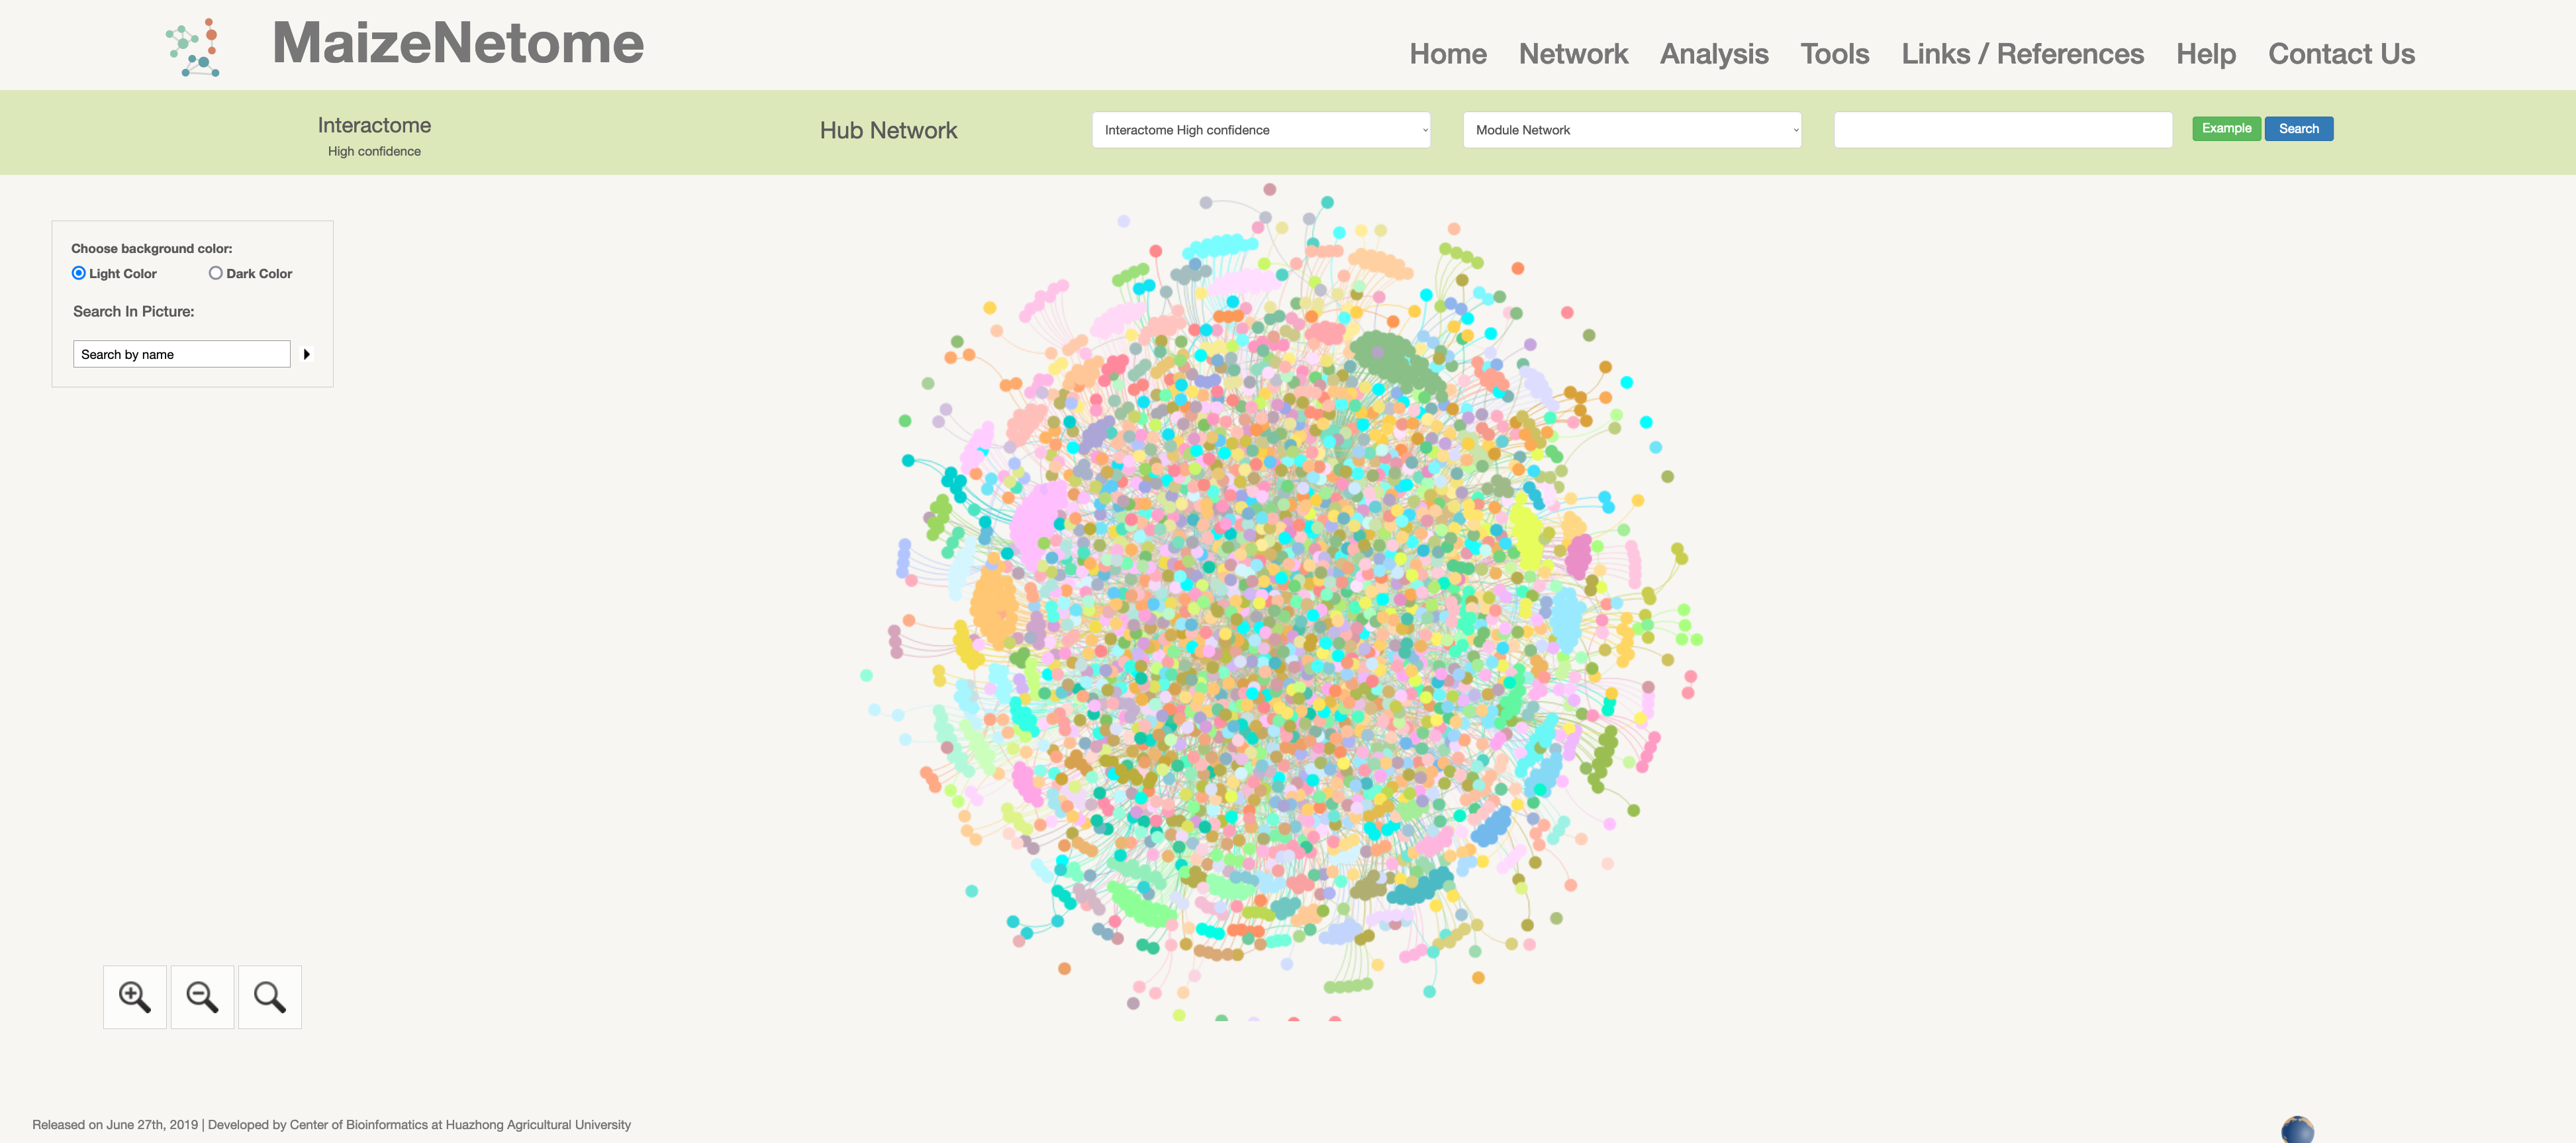
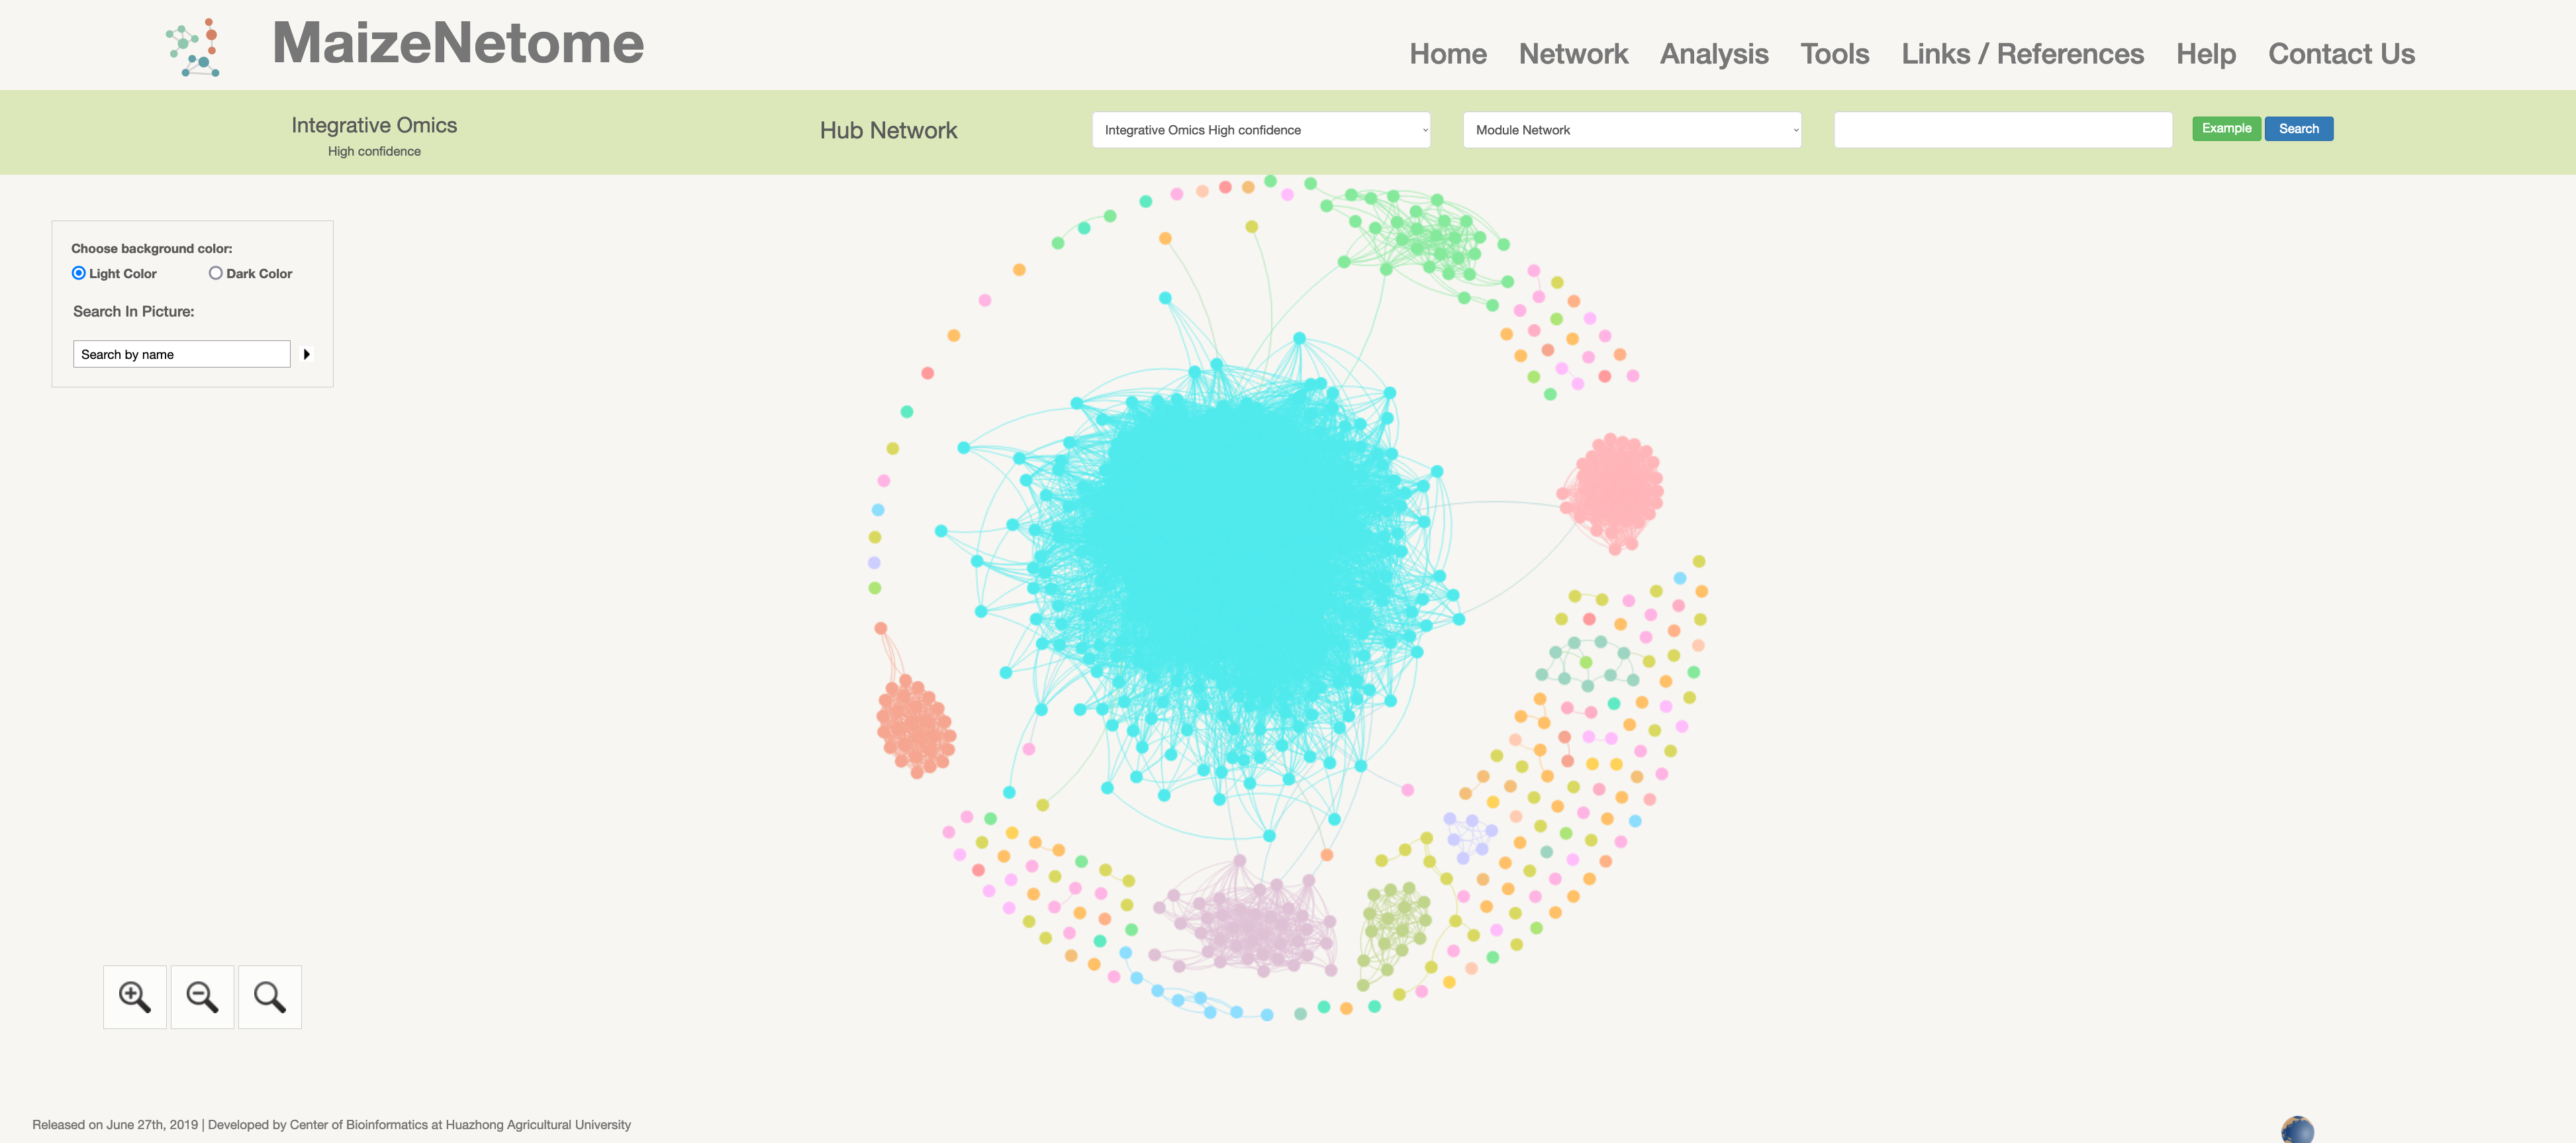
Hub network is the essence of the network. We construct the network by screening the top nodes in top modules to overview the network. 1. The red box 1 represents the omics and confidence of the network. 2. The red box 2 indicates the level of the network (Hub Network, Directly Connected Network, and Module Network). 3. In the red box 3, users can search for Directly Connected Network and Module Network in different confidences and omics. 4. In the red box 4, you can search for nodes in the current network and change the background color (Light Color and Dark Color).
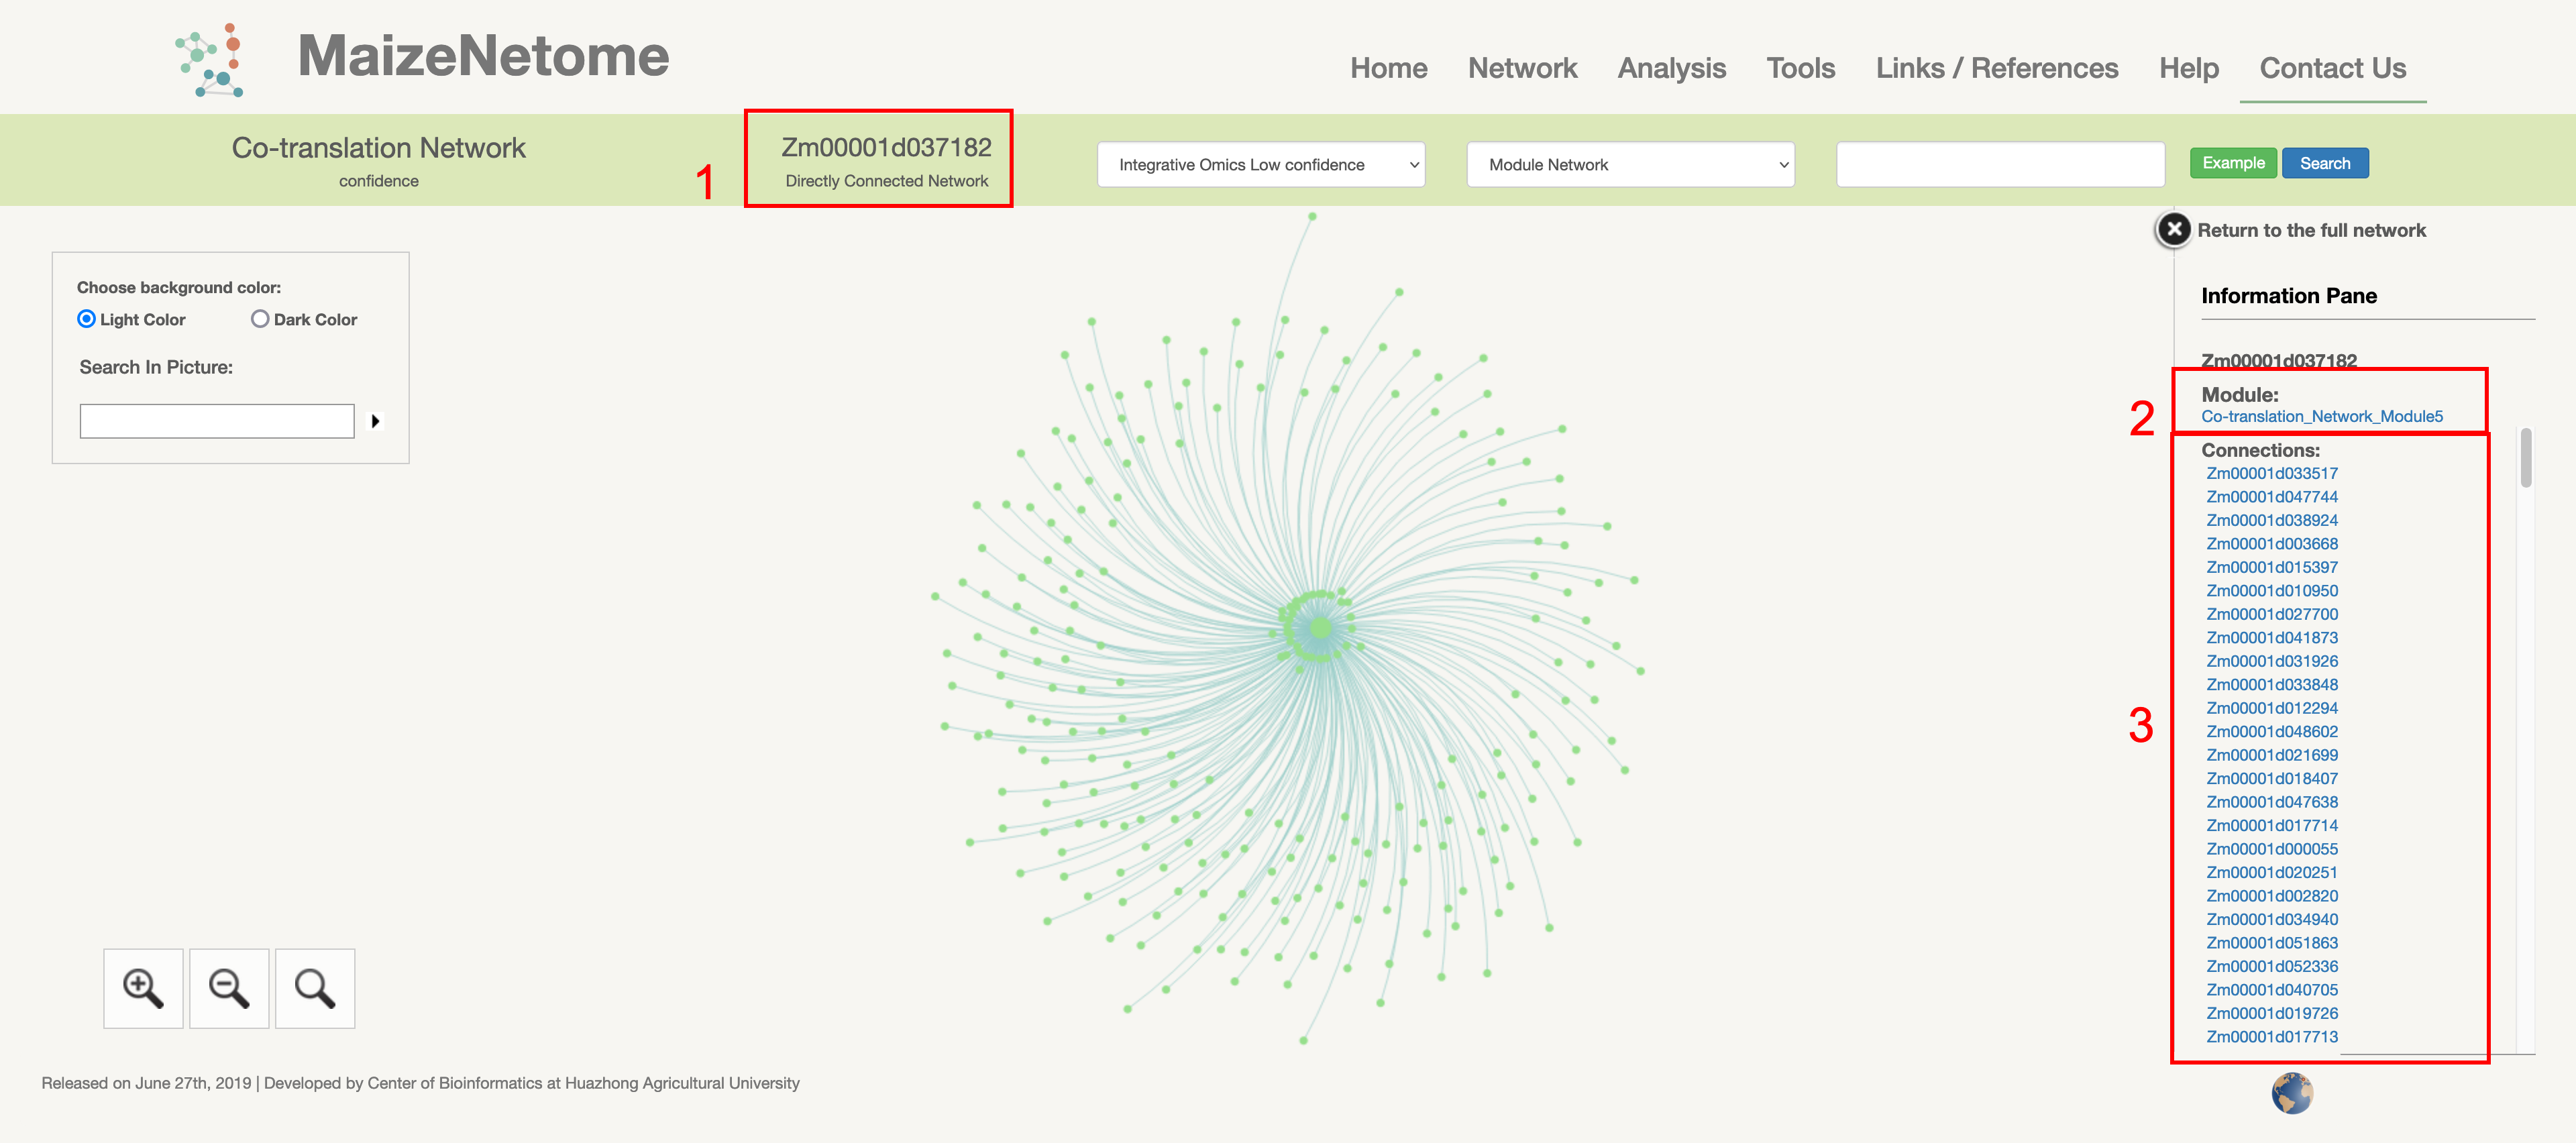
A node's directly connected network is formed based on the interaction between directly connected nodes. 1. The red box 1 shows the network type. 2. The red box 2 shows the module where the node is located. 3. The target node interaction nodes are shown in red box 3.
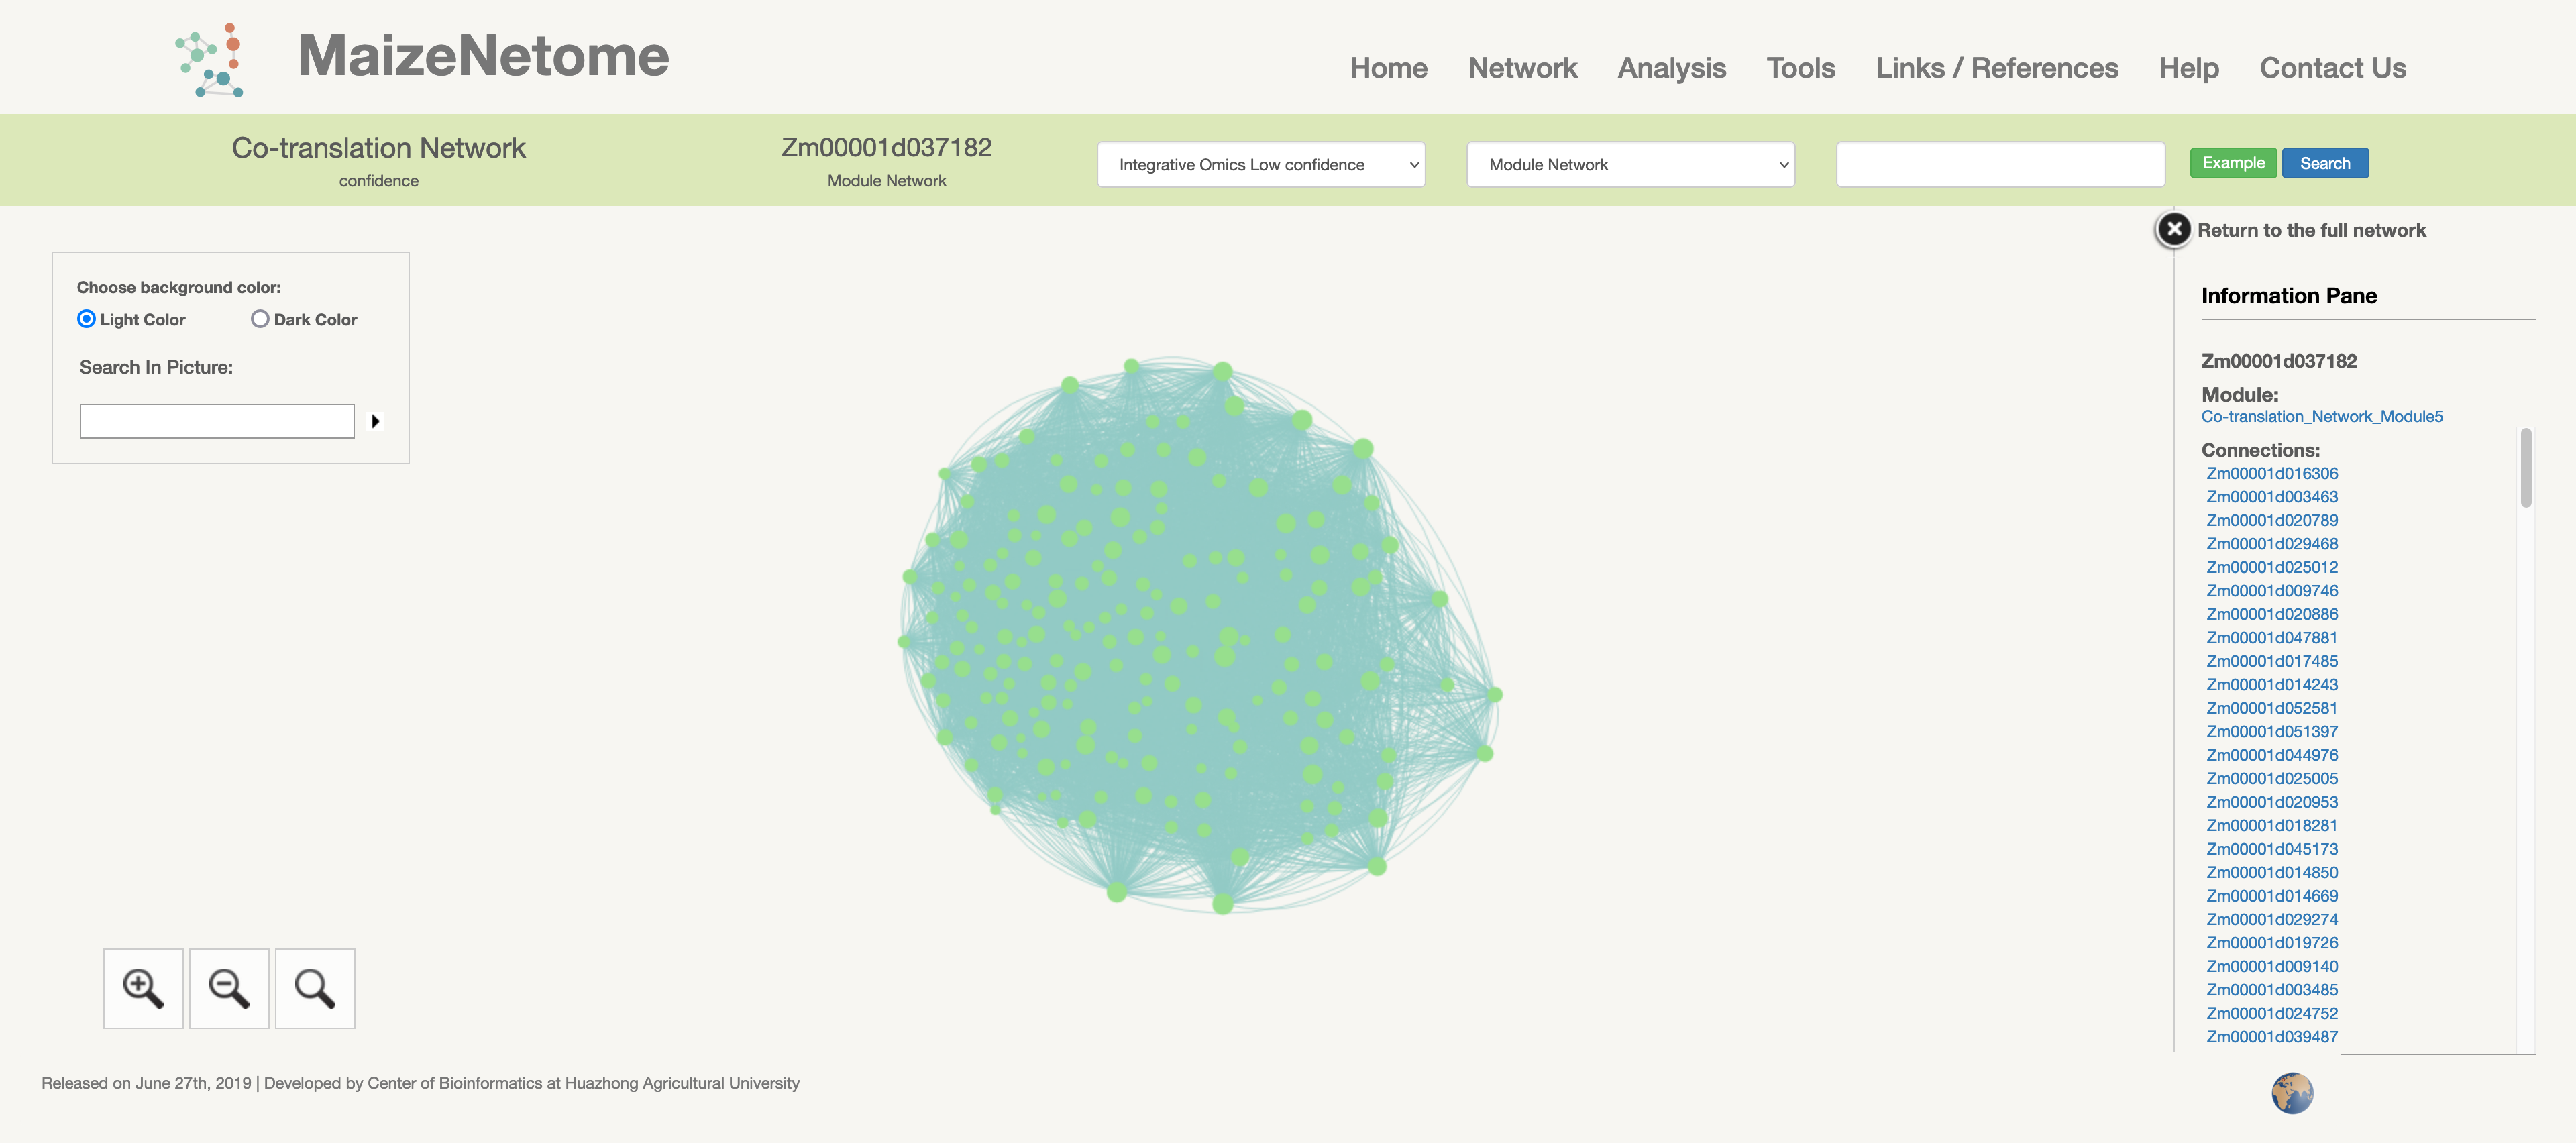
Sometimes, a node's directly connected network is difficult to help biologists understanding the role of a node in the network. Therefore, the Module network is used to portray the role of nodes in the network. Furthermore, the module network could monitor the target node's connection farther and more critically under limited resources.
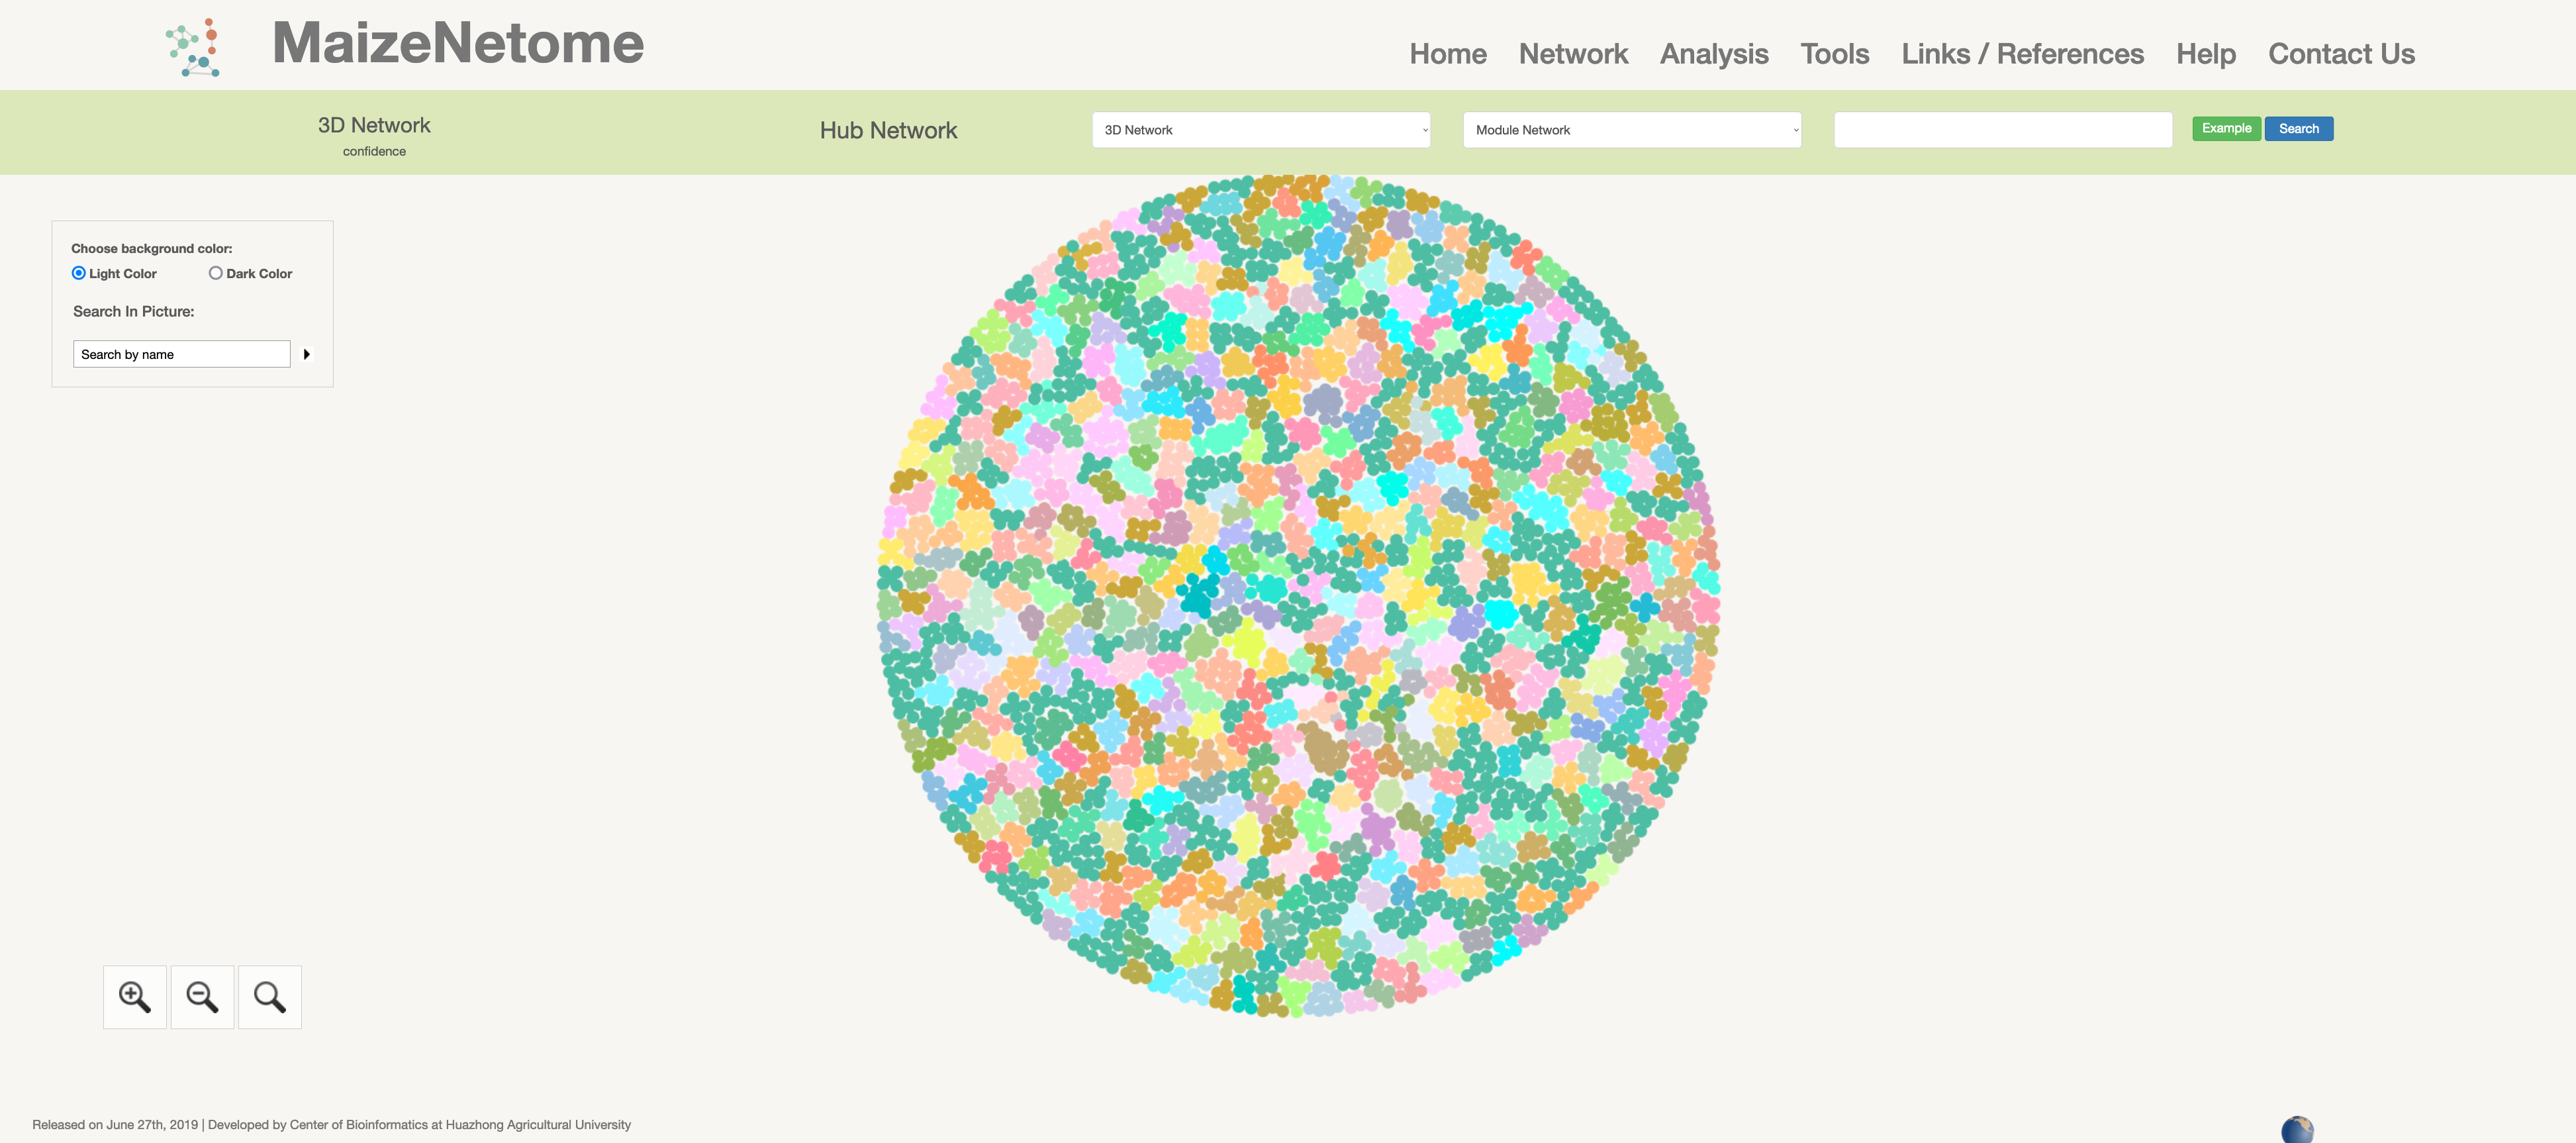
3D network from the ChIA-PET experiments of B73.
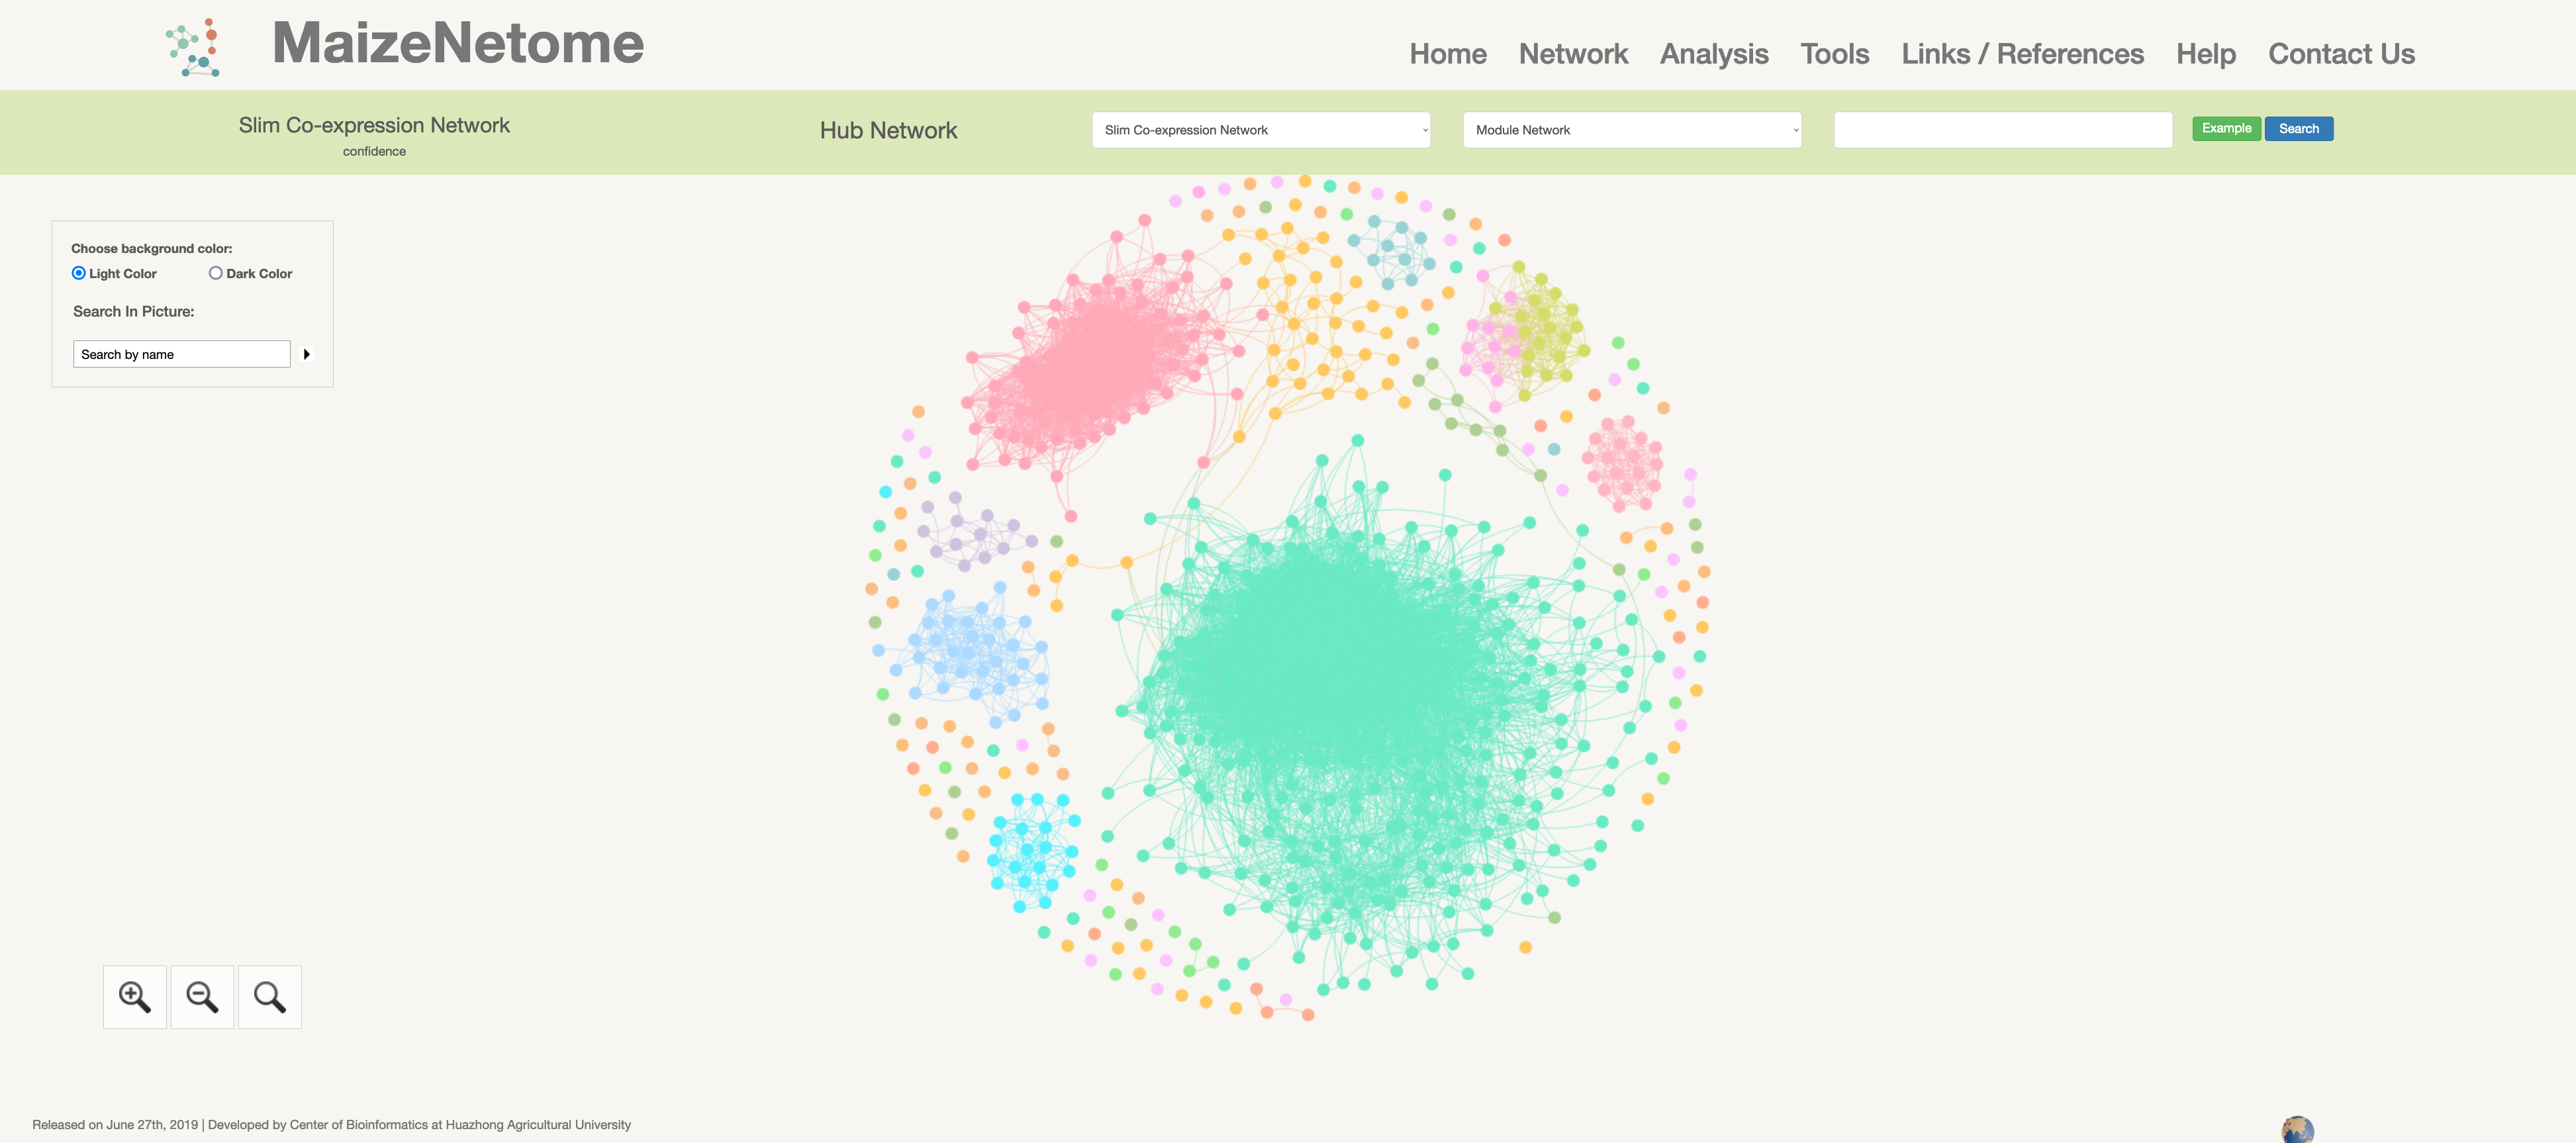
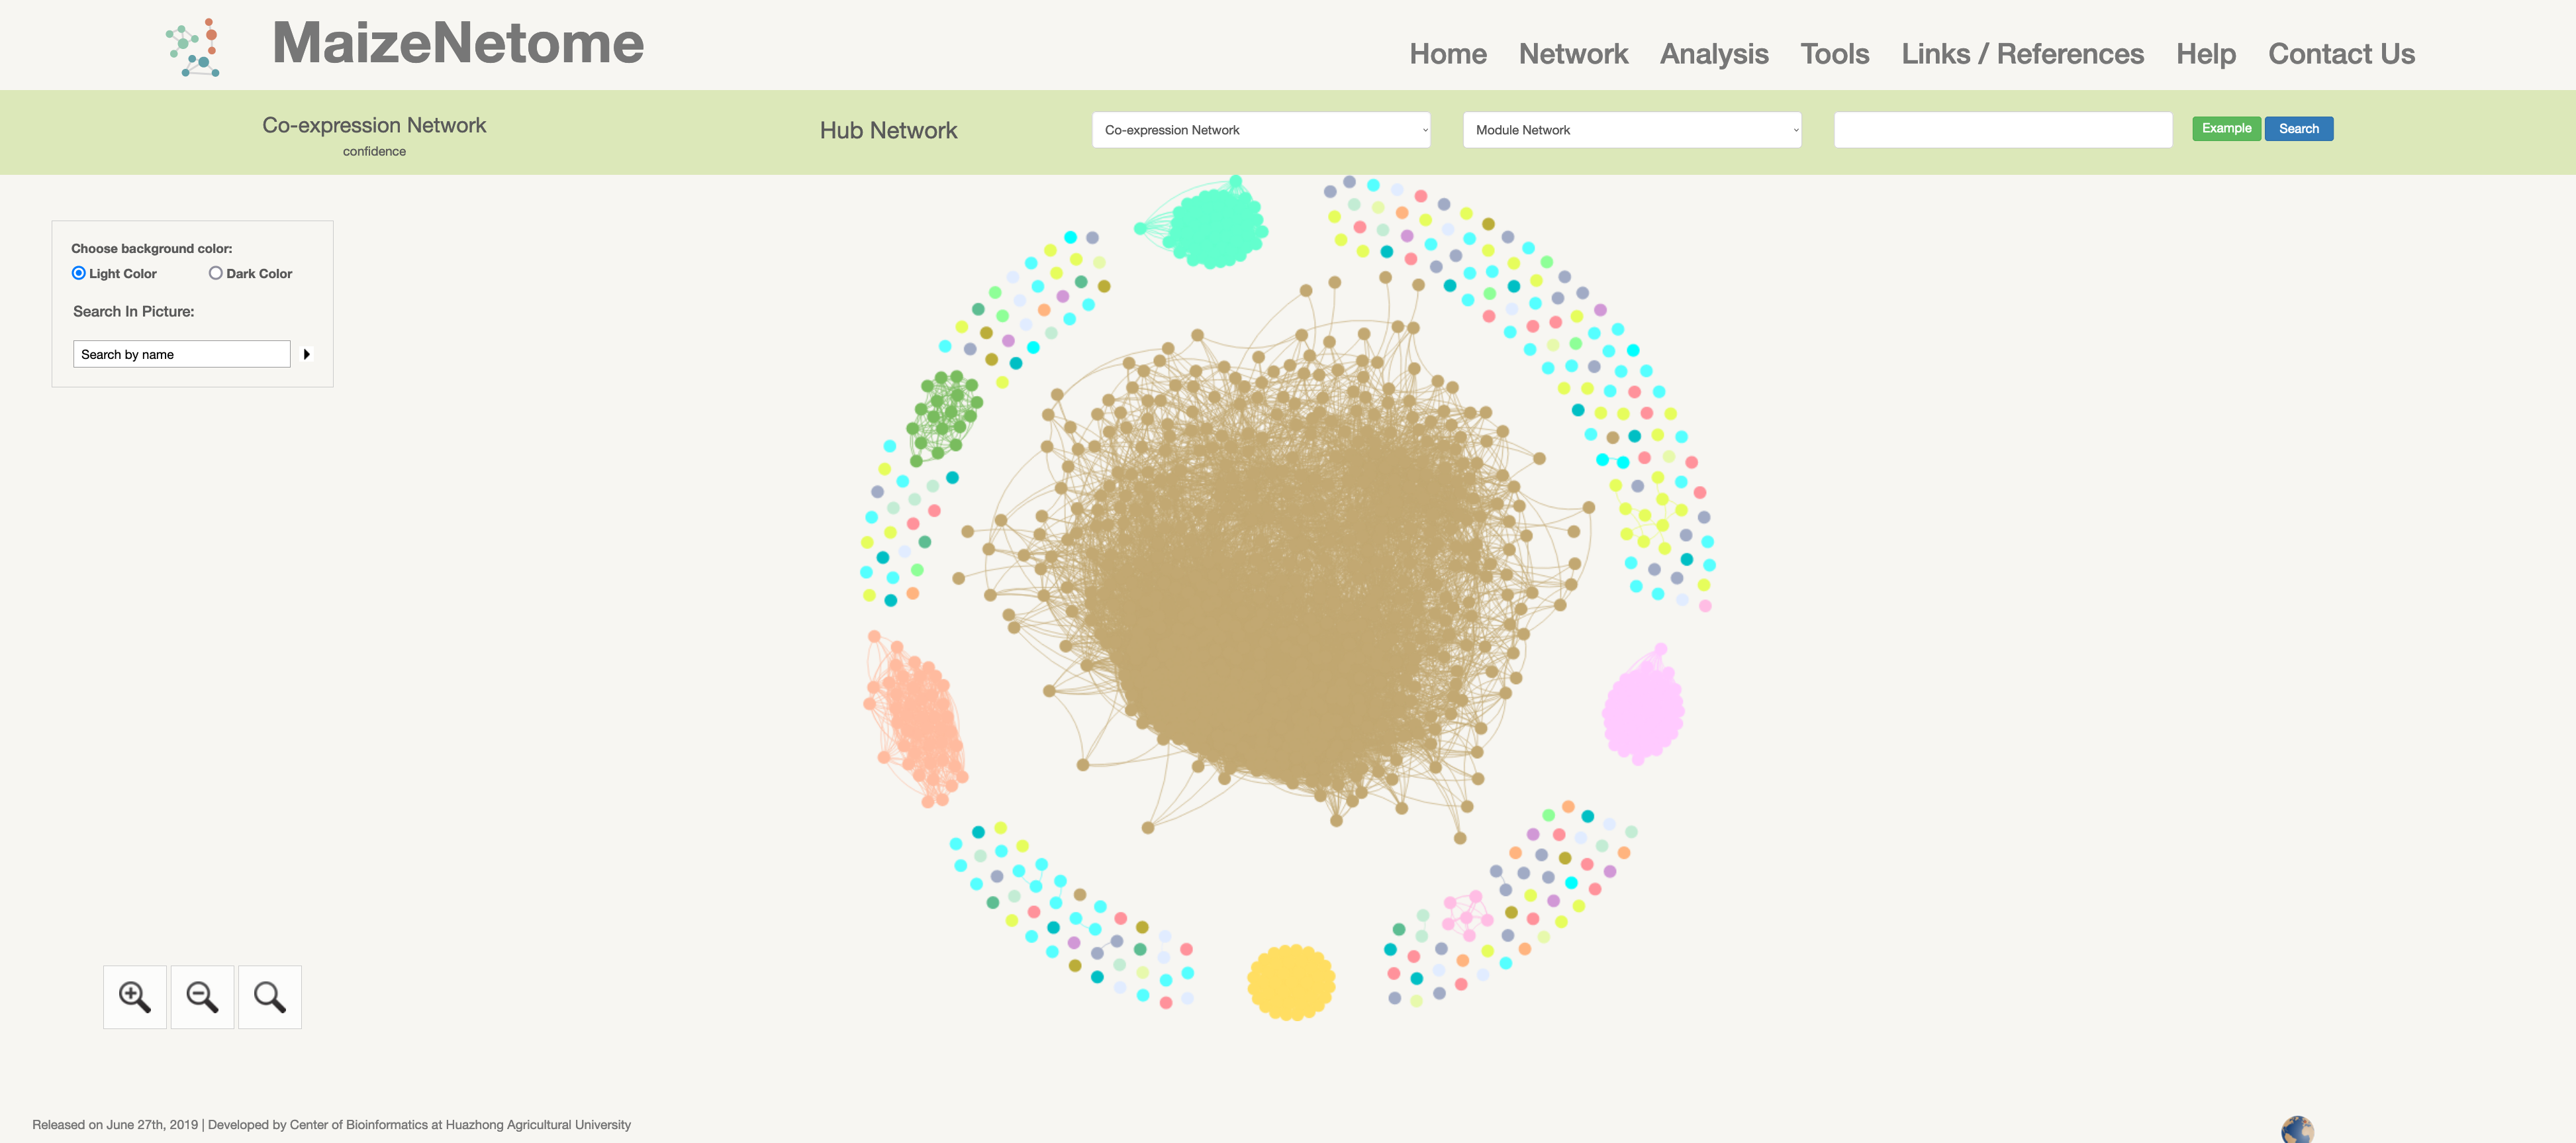
Slim Co-expression Network: Transcriptome co-expression network is constructed using the gene loci annotated by B73 version4 file from 31 tissues of B73. Co-expression Network: Transcriptome co-expression network is constructed by the RNA expressions ( including sRNA, circle RNA, fusion RNA, long non-coding RNA, and mRNA loci) from 31 tissues of B73.
Slim Co-expression Network
Co-expression Network
The translatome network is constructed by the ribosome-encapsulated RNA expressions level from 21 tissues of B73.
Co-translation Network
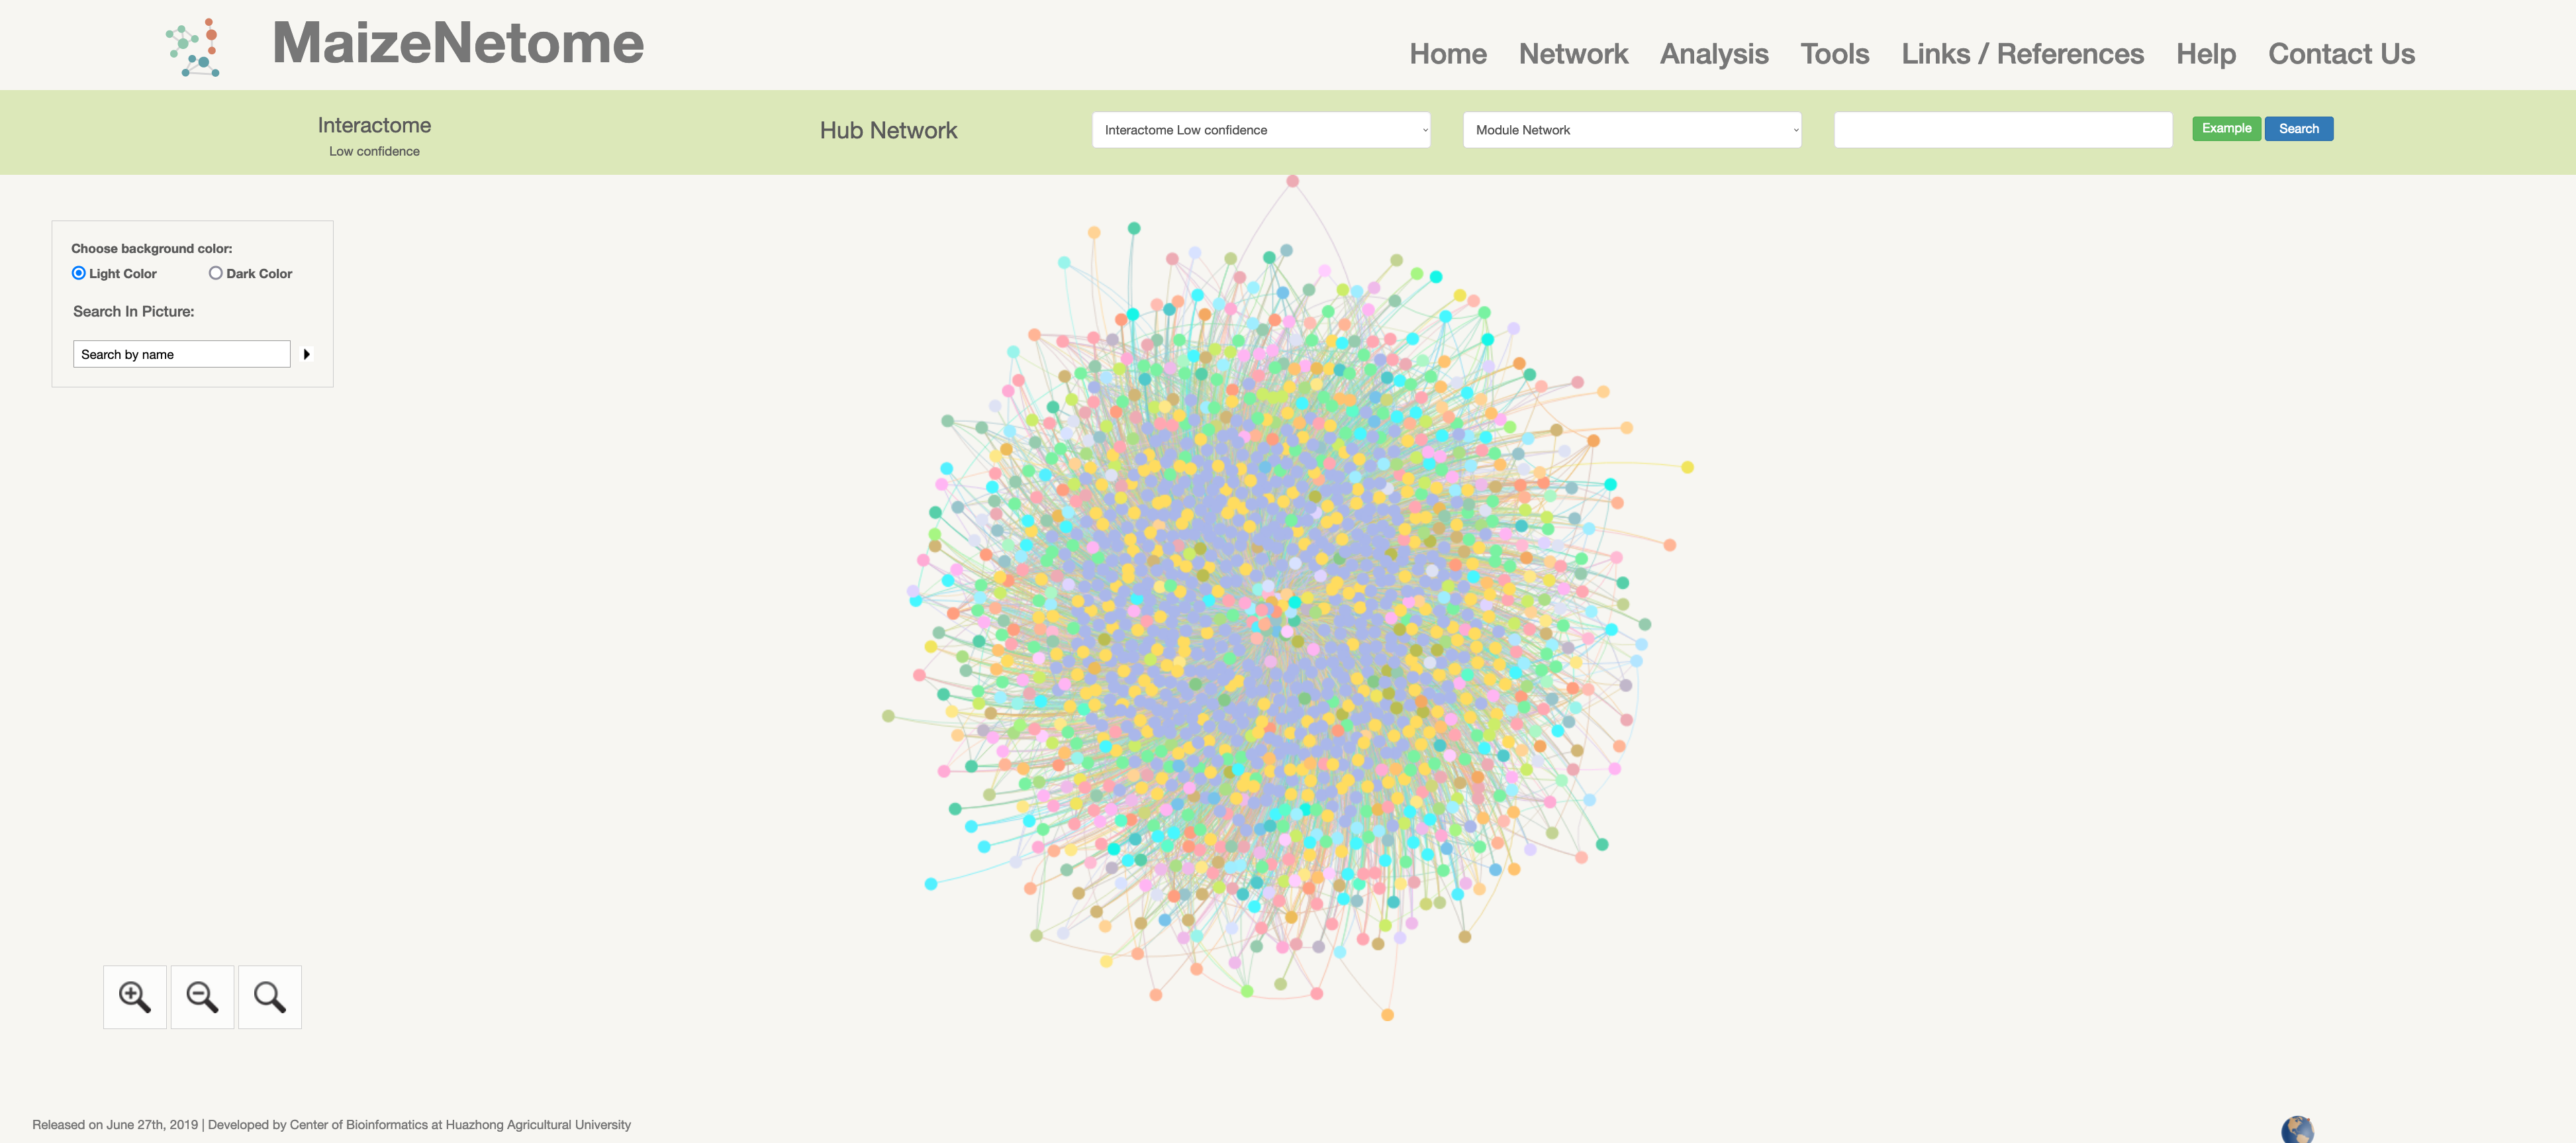
Protein-protein interactions network is constructed by high-throughput Yeast-2-hybridization experiments across eight distinct tissues of B73.
Interactome (low confidence)
Interactome (high confidence)
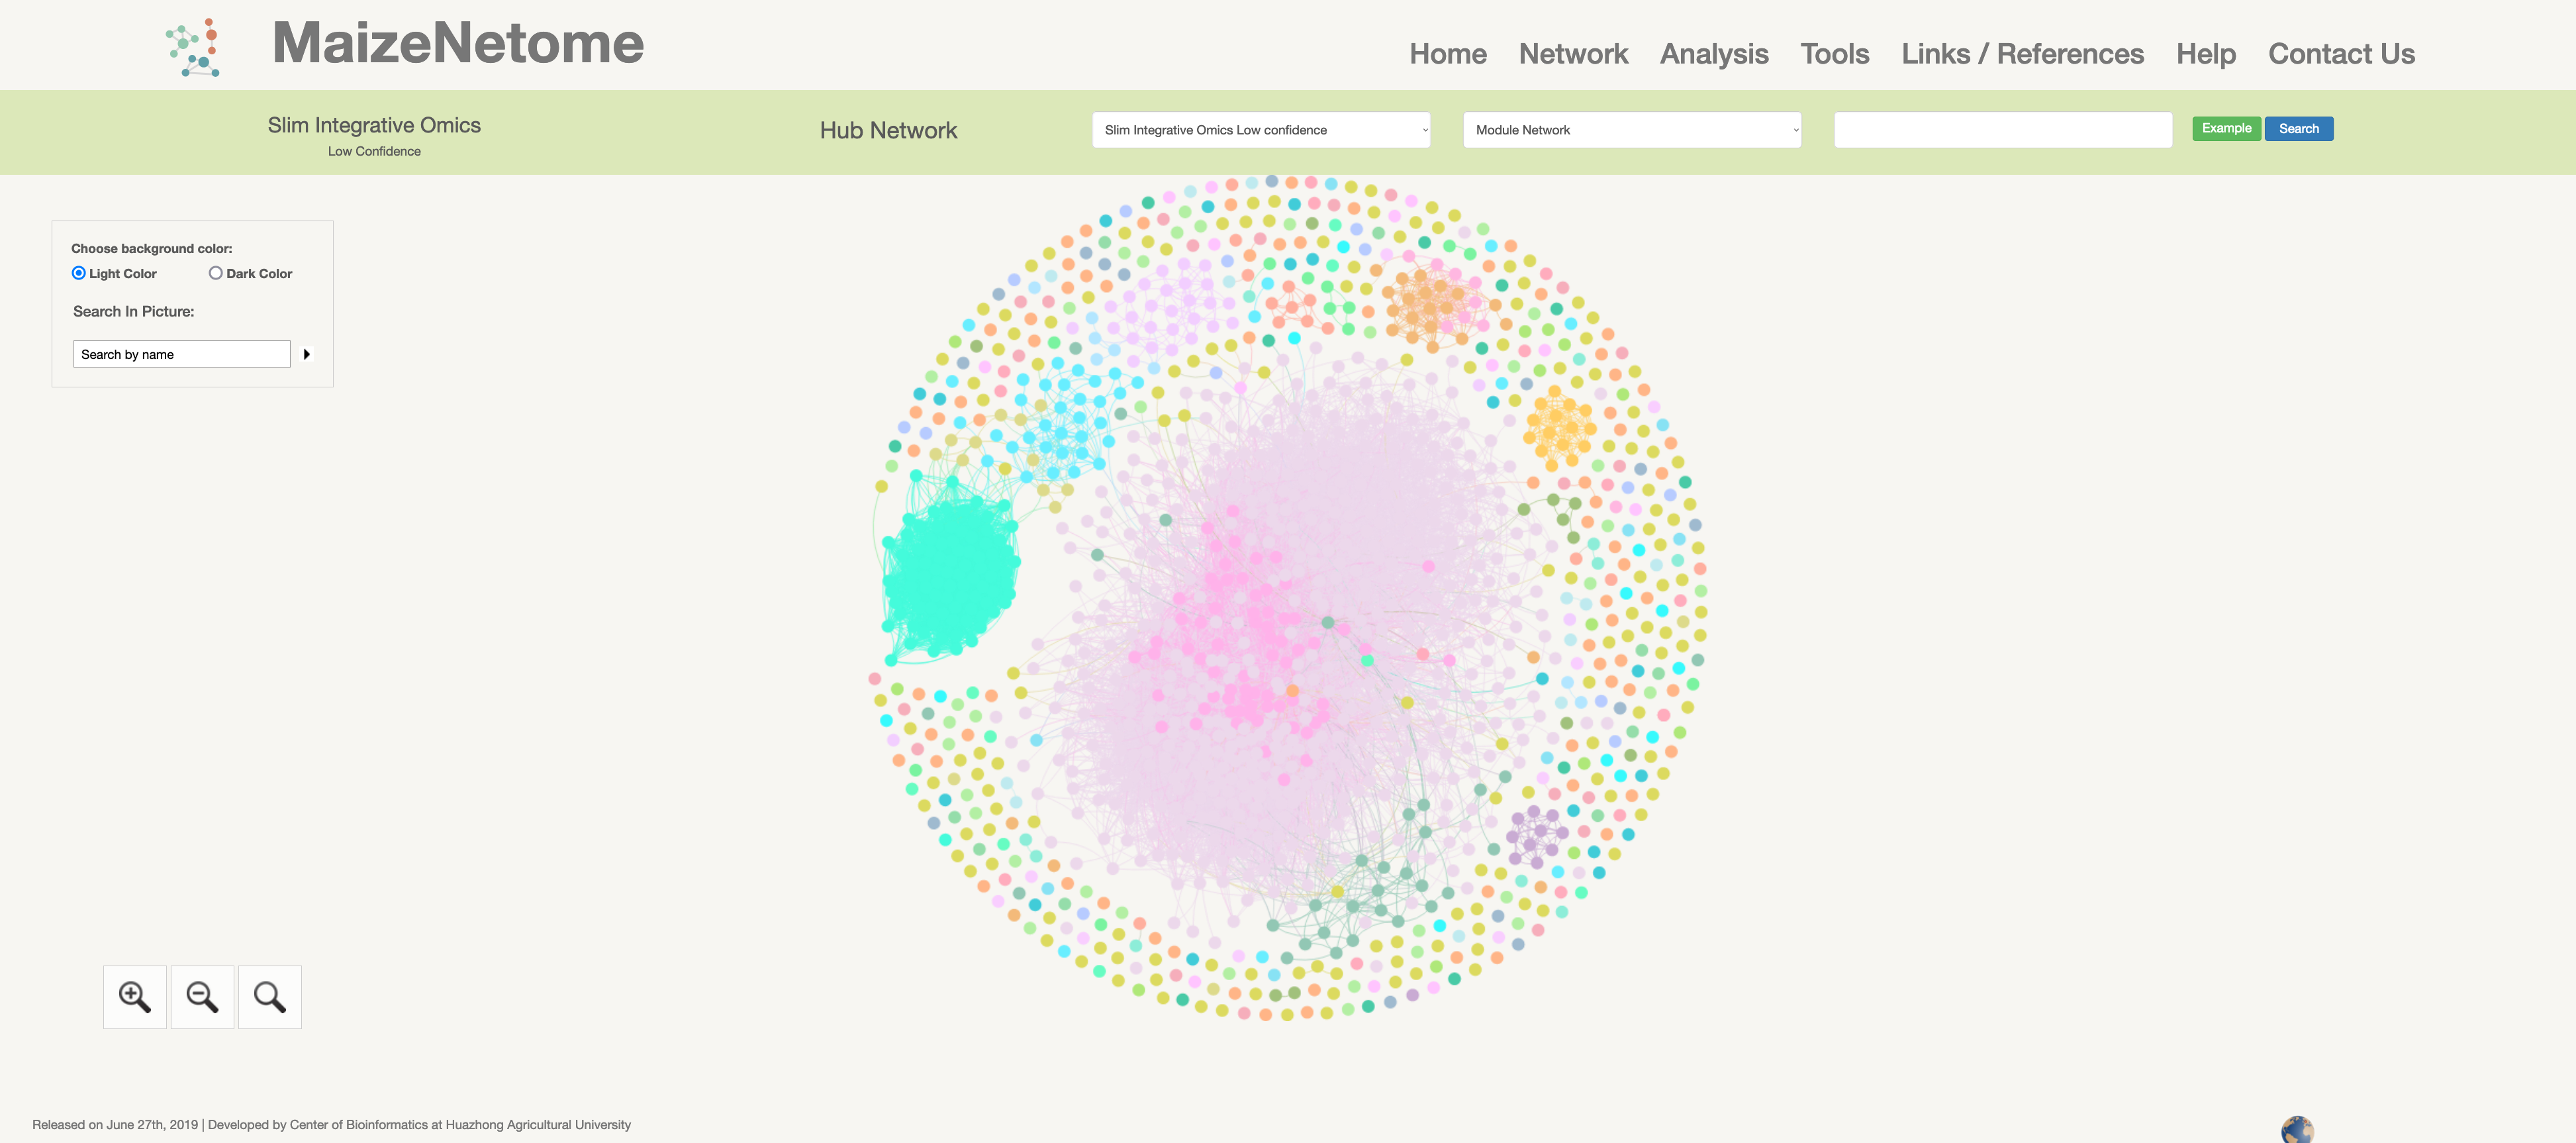
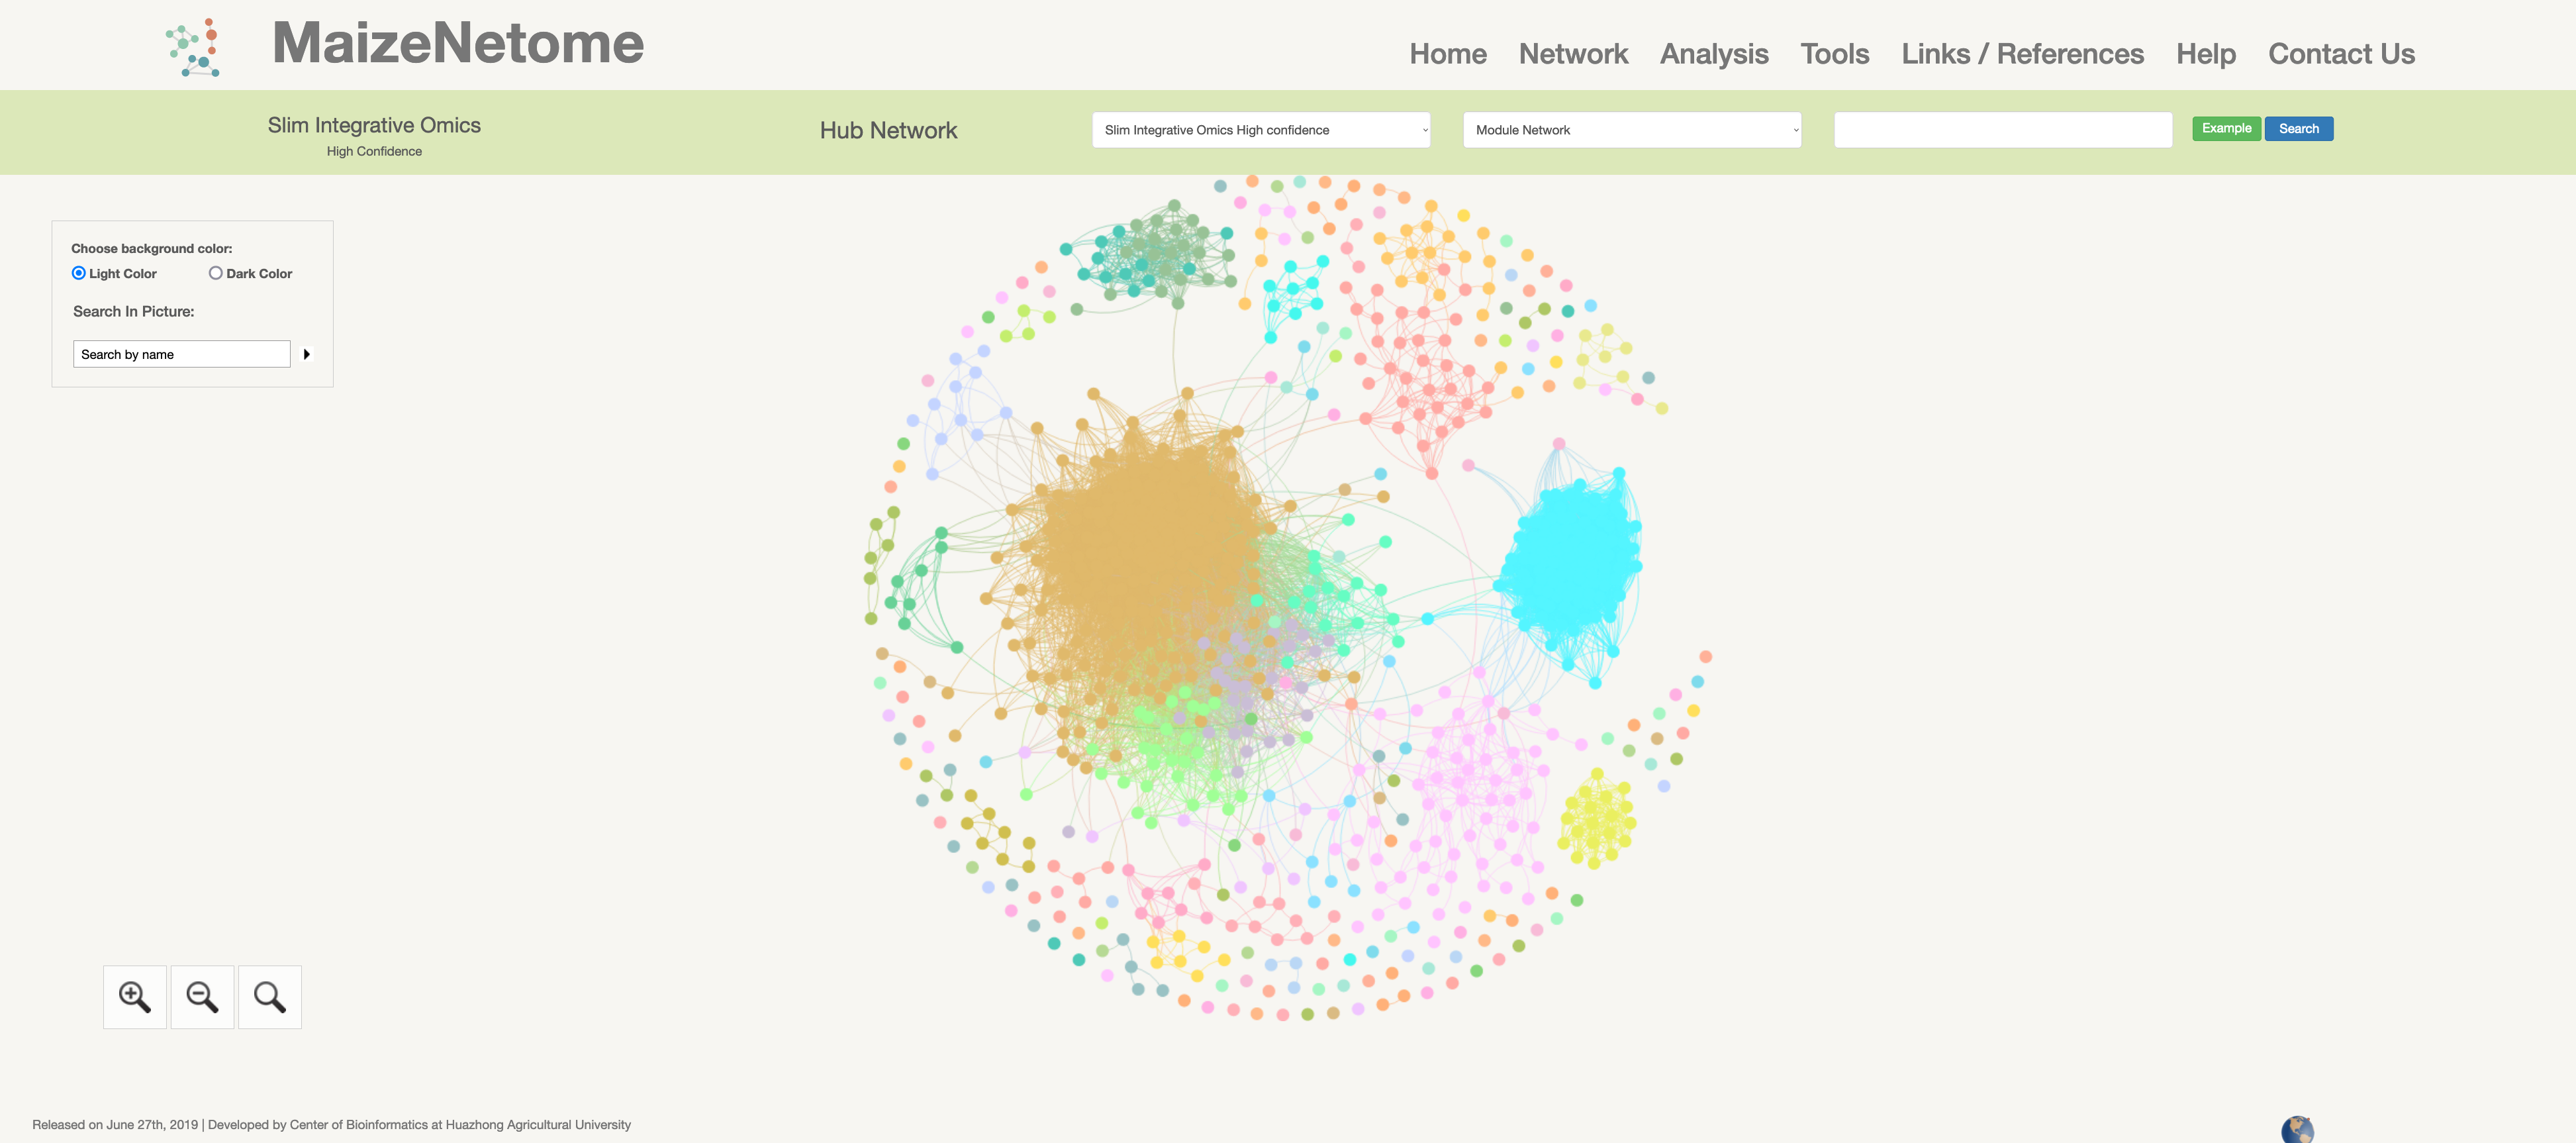
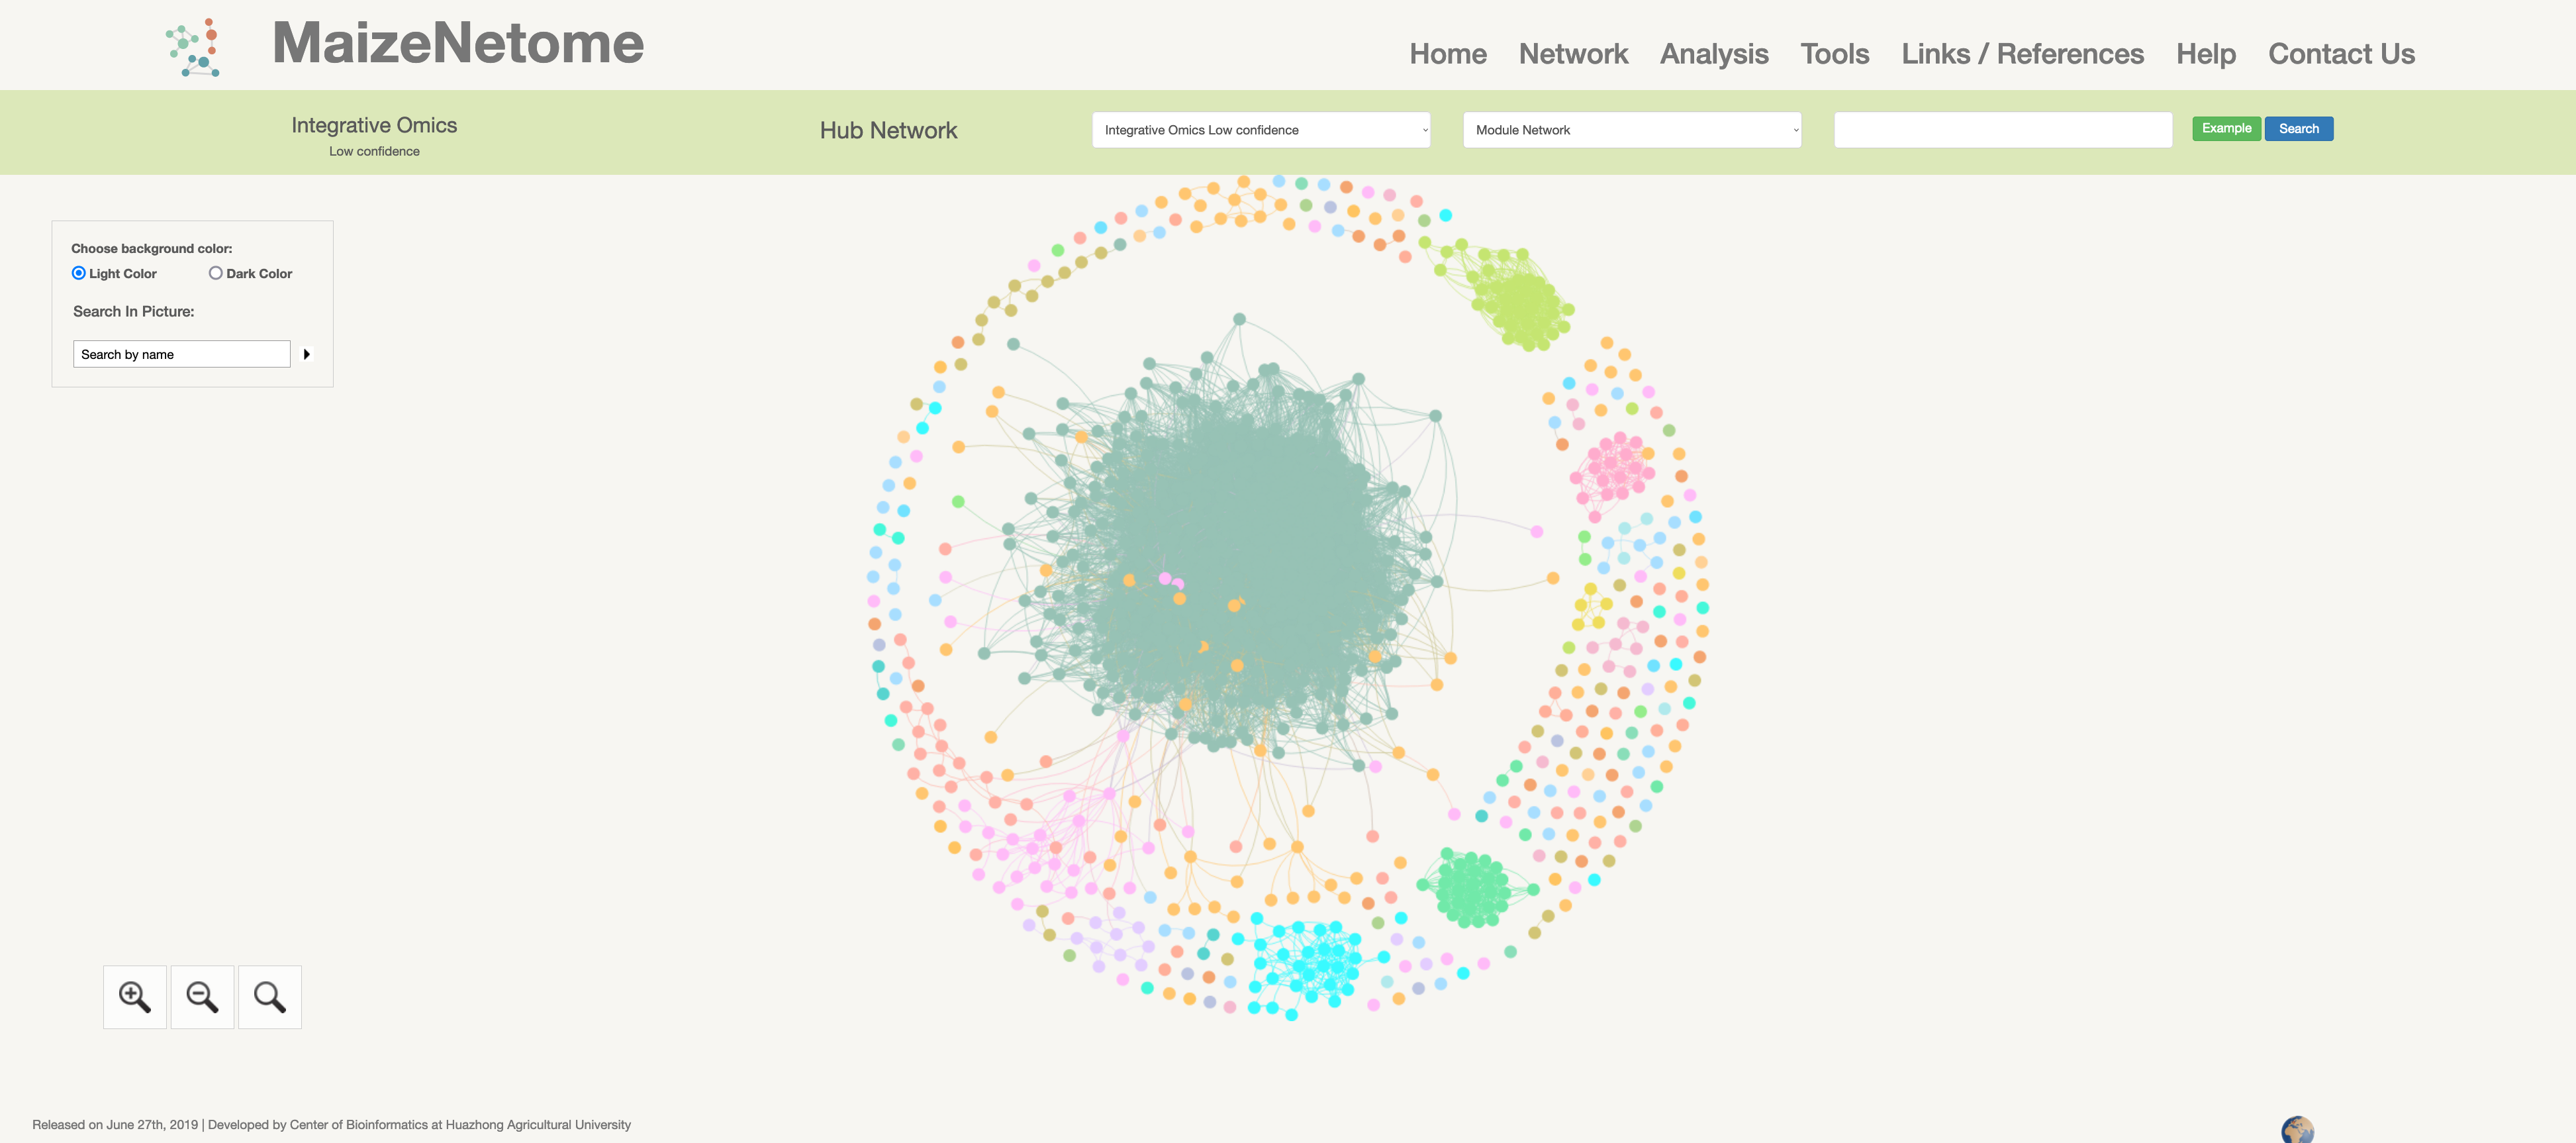
Slim-integrative Omics Network consists of corresponding 3D, Slim-transcriptome, translatome, and Interactome datasets. Integrative Omics Network consists of corresponding 3D, transcriptome, translatome, and Interactome datasets.
Slim-integrative Omics Network (low confidence)
Slim-integrative Omics Network (high confidence)
Integrative Omics Network (low confidence)
Integrative Omics Networkm (high confidence)
We developed three analysis based on our database, namely QTG Interaction Score, Trait Decoder, and Pathway Mapping. These analysis will offer some valuable information to help biologists in identification of the major gene in QTL, biological pathway, and gene regulation of specific traits.
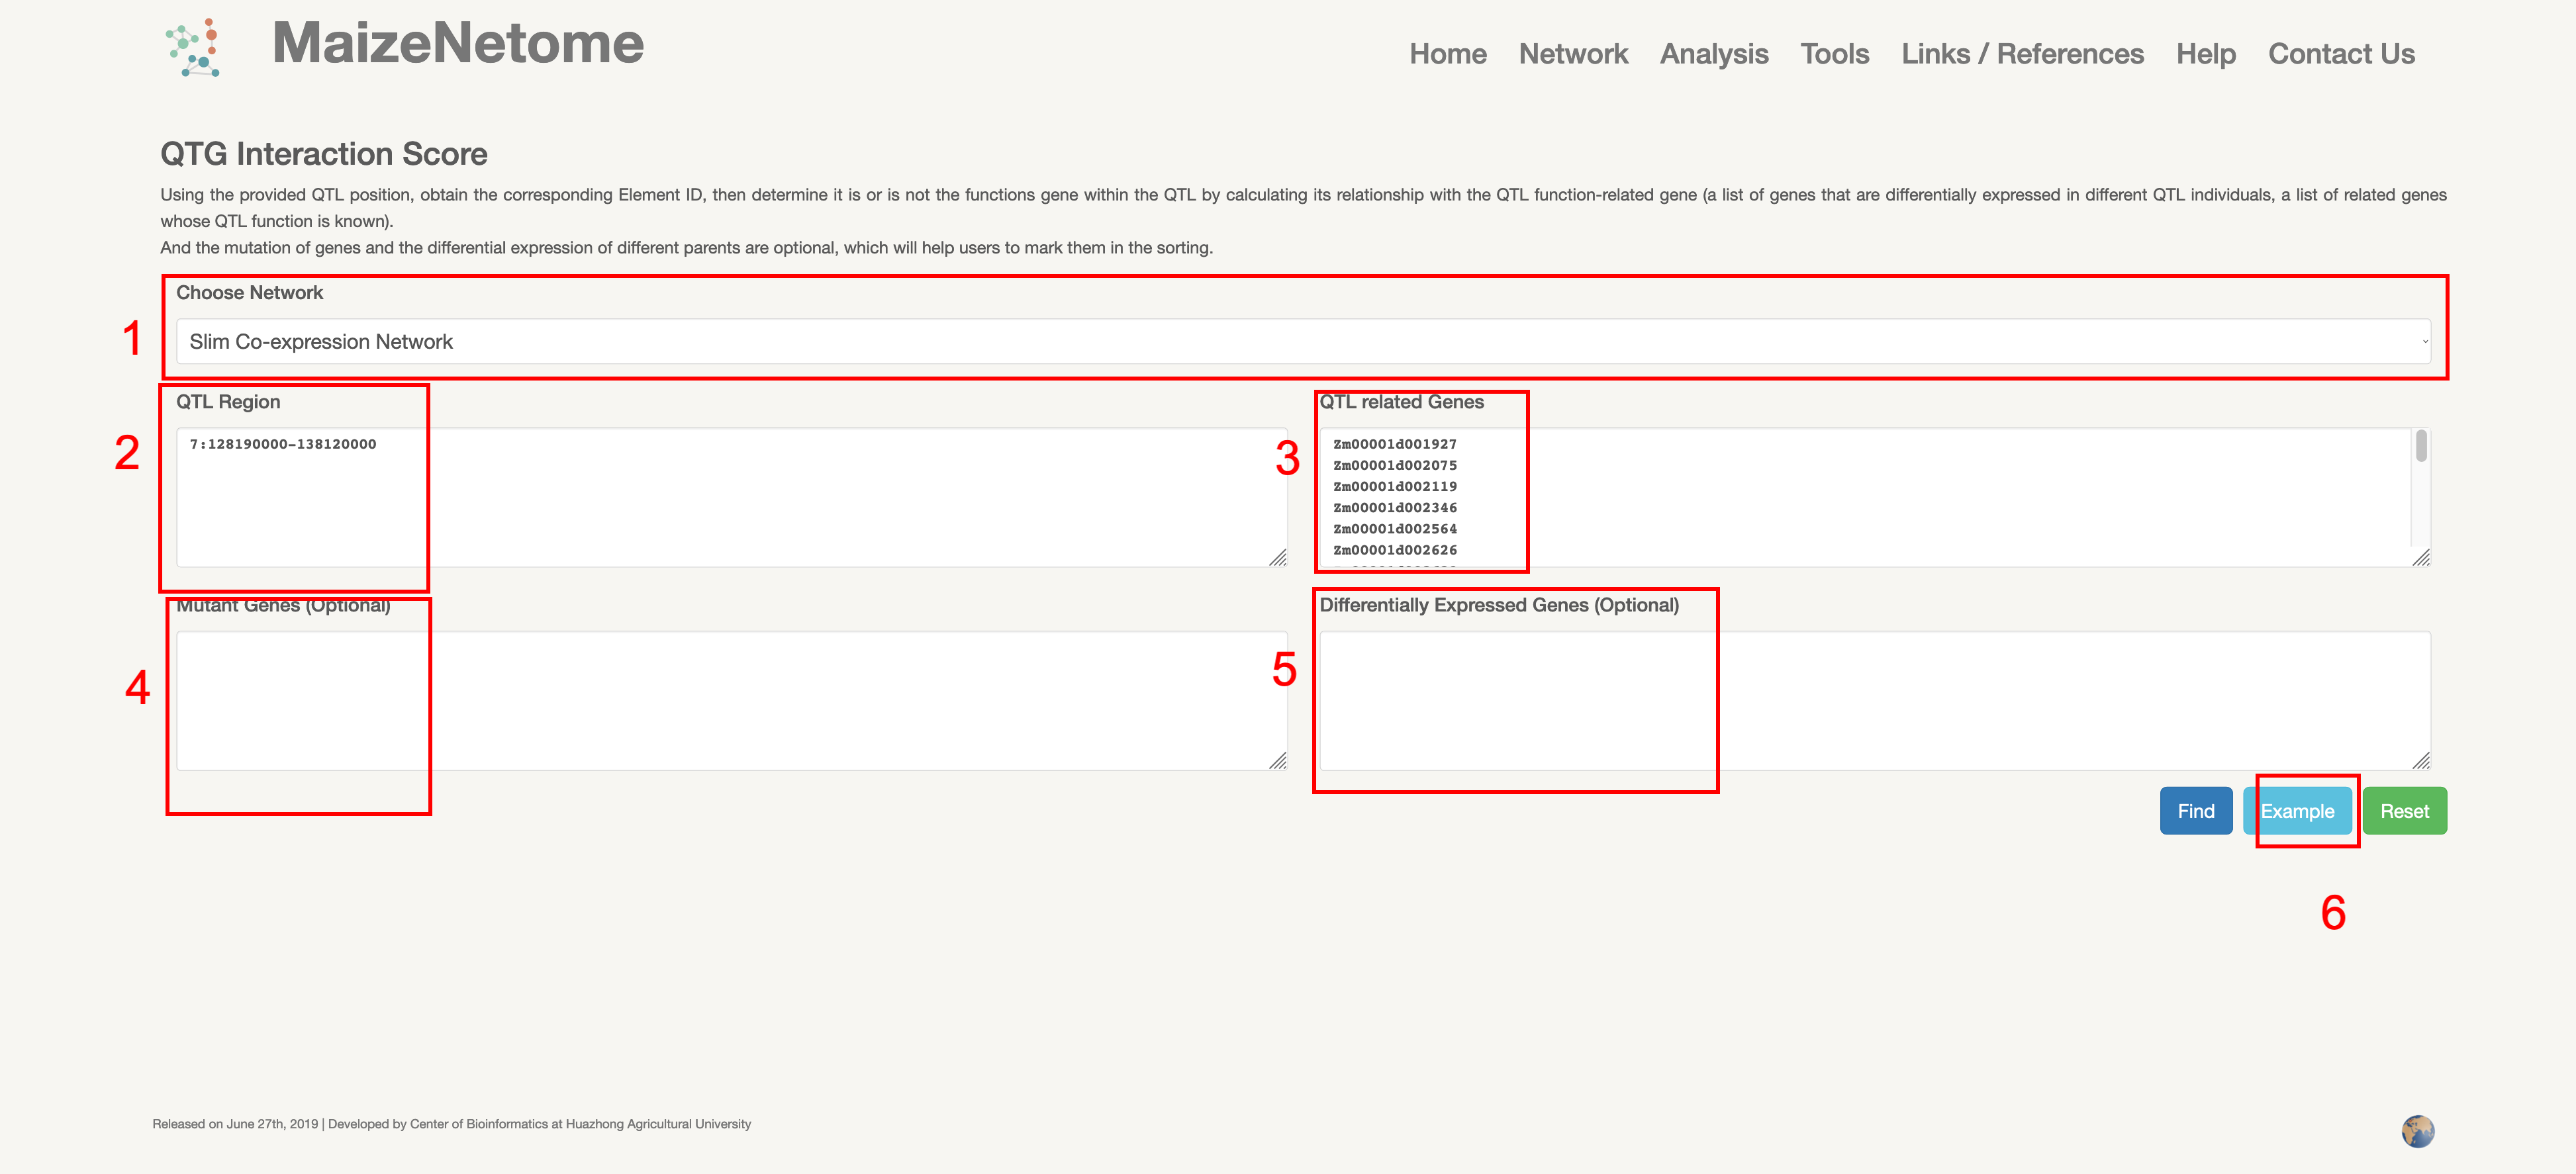
We developed a method (QTG Interaction Score) to assist in the localization of QTL candidate genes for exploring unknown genes. The traditional QTL positioning usually builds a multi-generation group to screen and reorganize individual plants to narrow the interval continuously. However, QTG Interaction Score can quickly reduce the range of genes in QTL by the network data. Users can input the QTL position and potential QTL-related Elements (a list of genes that are differentially expressed in different QTL individuals, a list of related genes whose QTL function is known) to predict the major-effect locus in the QTL position. And the mutation of genes and the differential expression of different parents are optional, which will help users to mark them in the sorting.
1. Red box 1: Users can choose network type. 2. Red box 2: Enter the QTL interval (examples: chromosome: start-end) as shown in the picture. 3. Red box 3: Enter potential reciprocal genes, either genes from population differential expression; or known genes associated with the trait. 4. Red boxes 4 and 5: help users to annotate genes (genes with mutations and differential expression) 5. Red box 6: Click to see examples of the input.
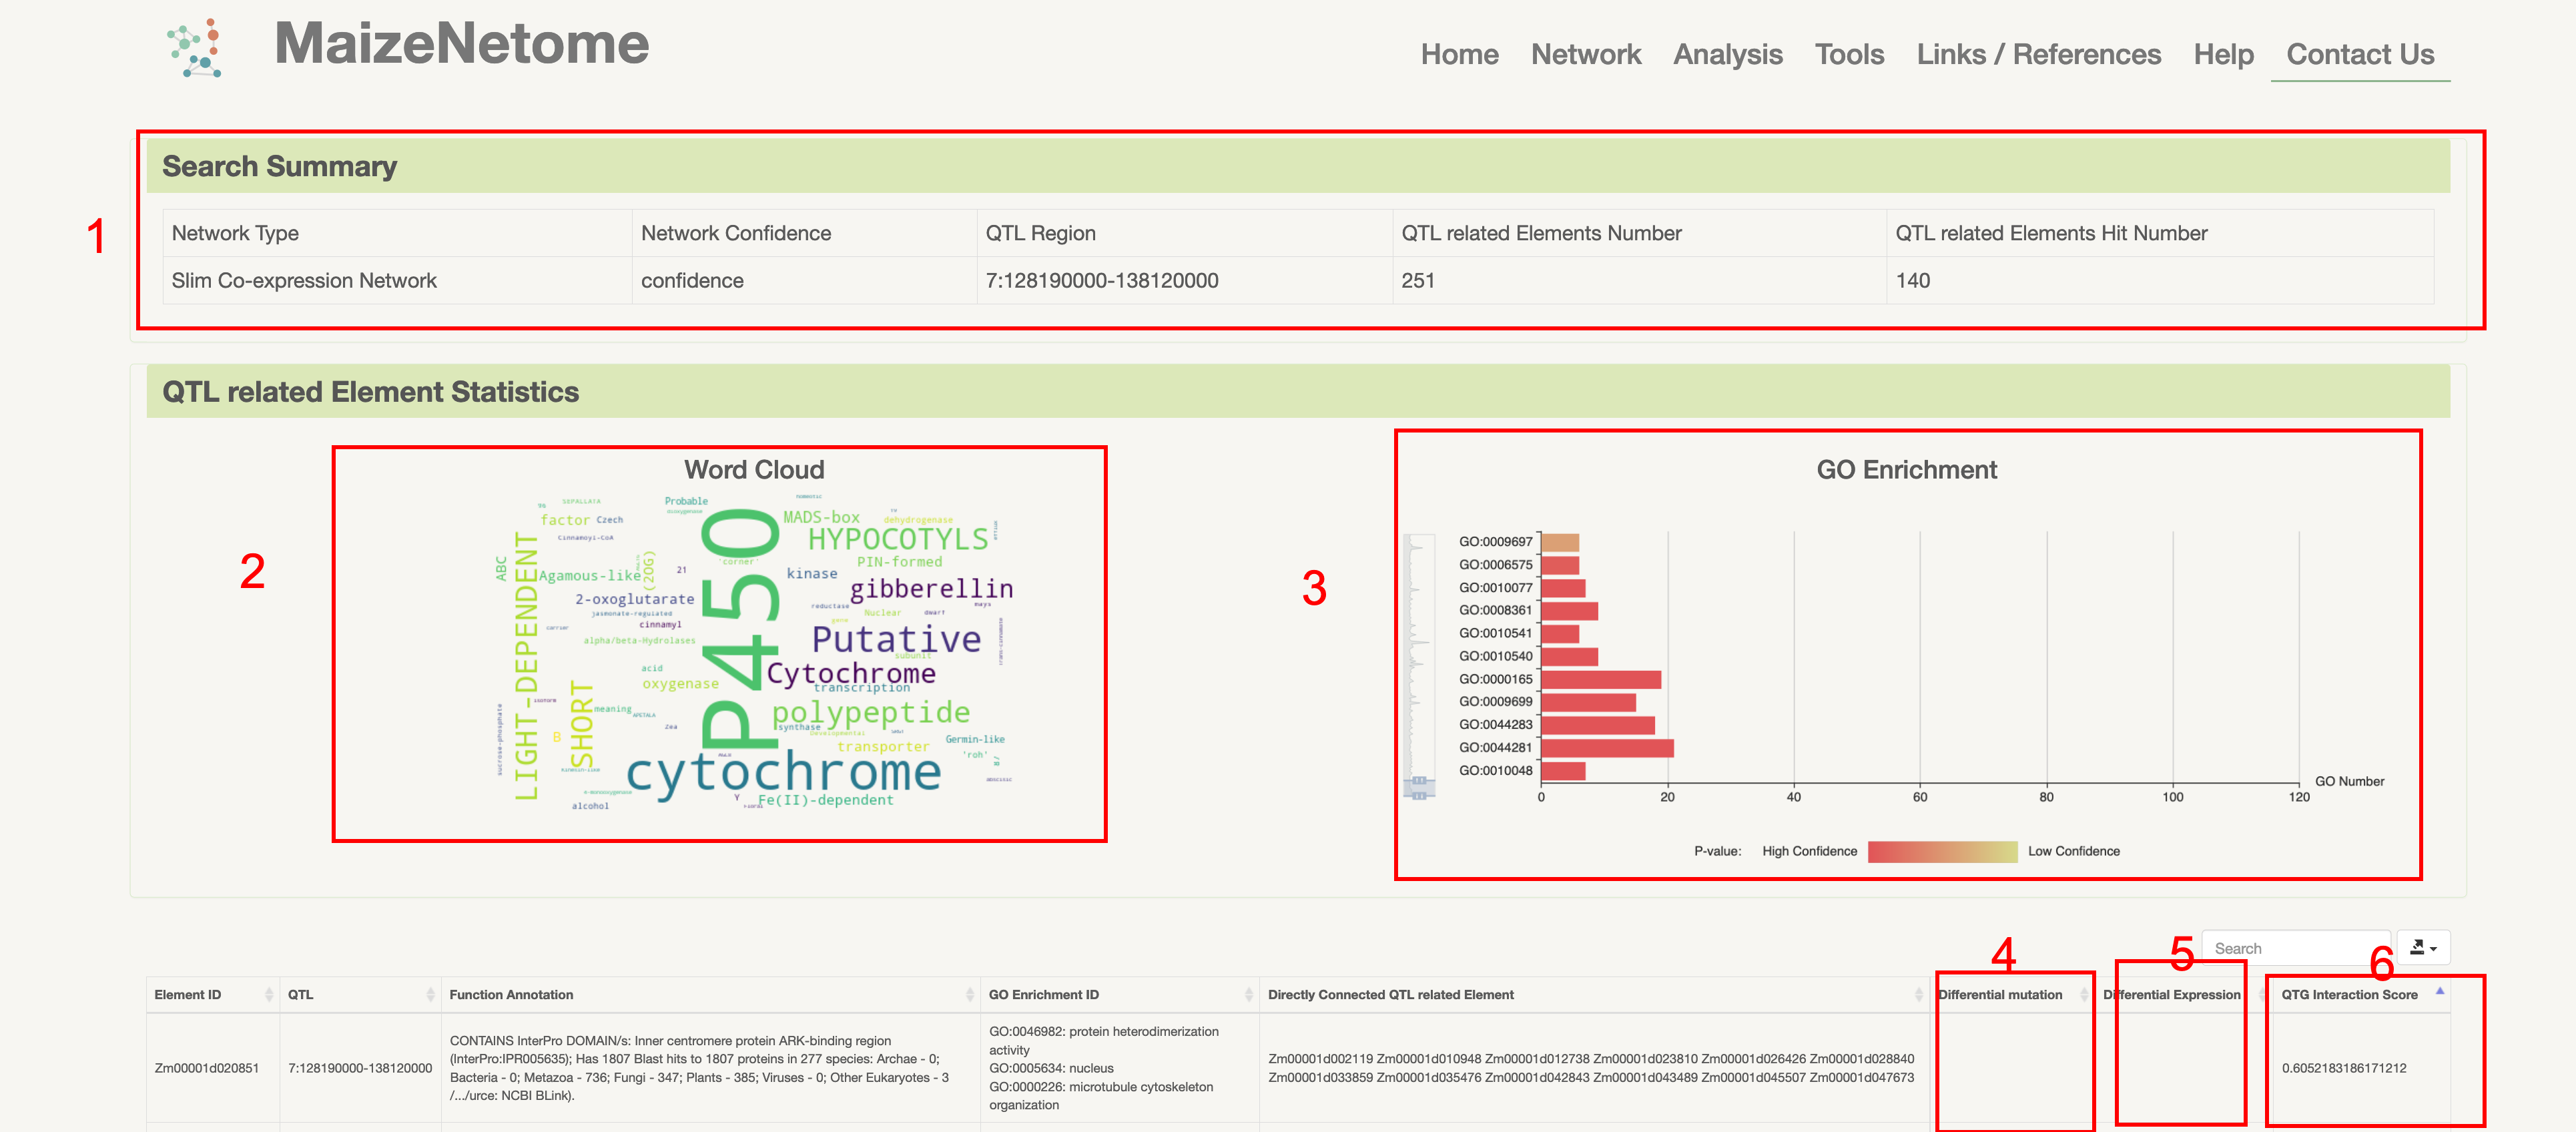
1. Red box 1: Summary of search results 2. Red box 2: Summary of word cloud for QTL related Element function annotation 3. Red box 3: QTL related Element GO enrichment analysis result 4. Red boxes 4 and 5: help users to annotate genes (genes with mutations and differential expression) 5. Red box 6: QTG Interaction Score, smaller value means more interactions with QTL related Element.
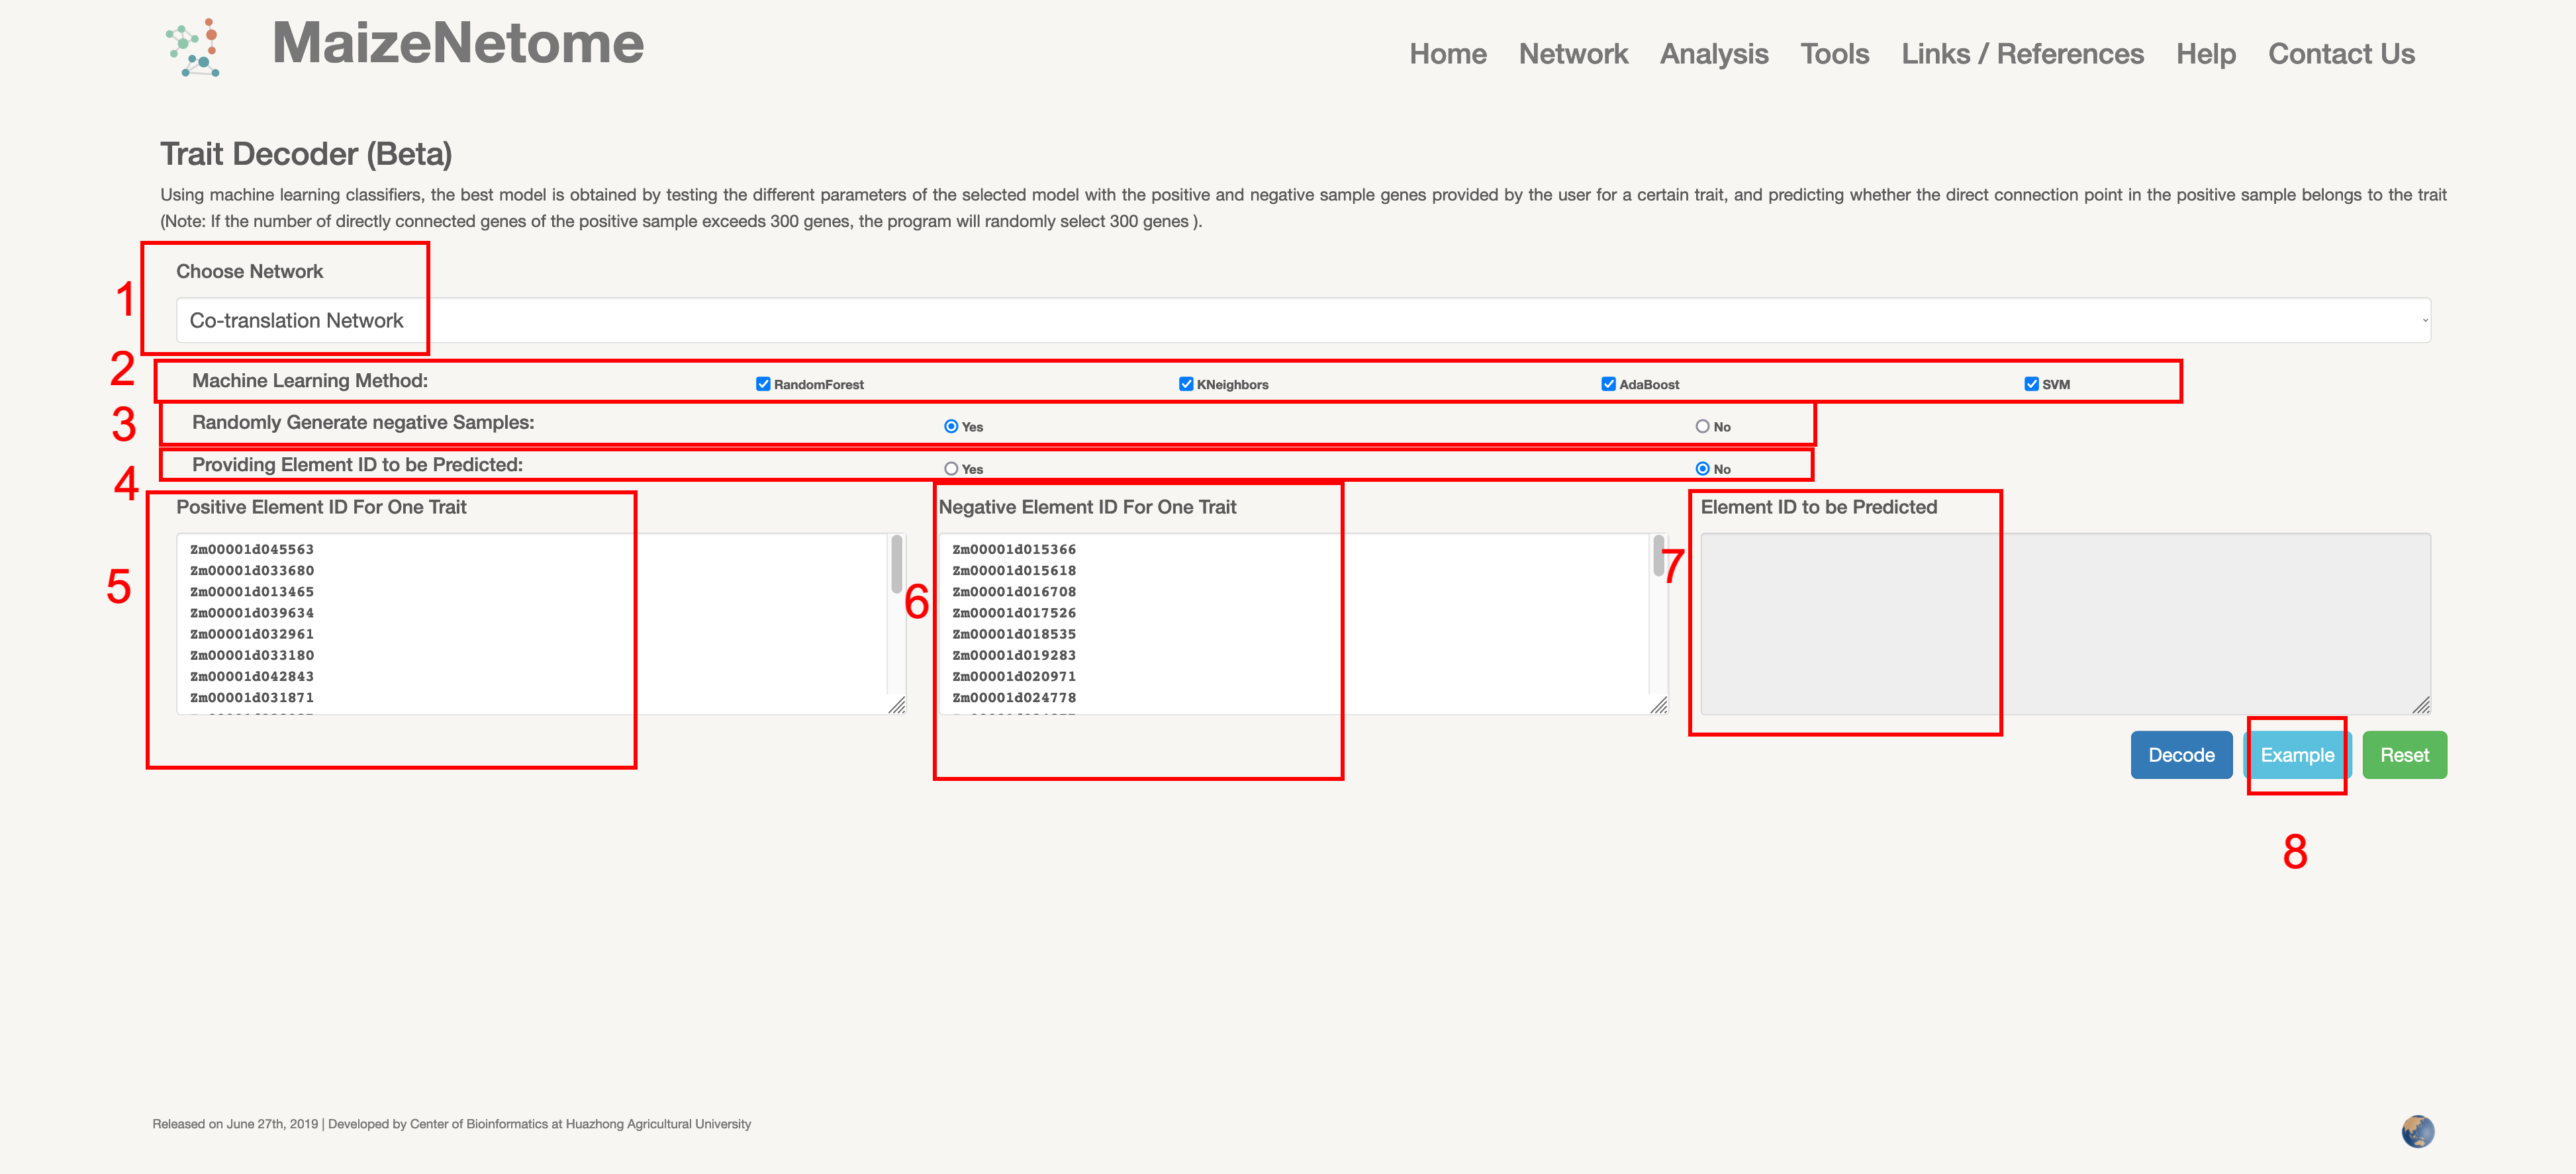
The Trait Decoder can predict trait-related unknown genes by some known genes. A machine learning classifier can be used to test different parameters of the selected model by calculating the AUC score. And can be predicted whether directly connected genes of the positive sample are associated with the trait.
1. Red box 1: Users can choose network type. 2. Red box 2: Select the desired Machine Learning method. 3. Red box 3: Whether to randomly generate negative elements. 4. Red box 4: Whether to provide the predicted Element ID, if not, 300 elements will be randomly selected to directly interact with the positive elements. 5. Red box 5: Input box for positive elements. 6. Red box 6: Input box for negative elements. 7. Red box 7: Input box for the elements to be predicted. 8. Red box 8: Click to see examples of the input.
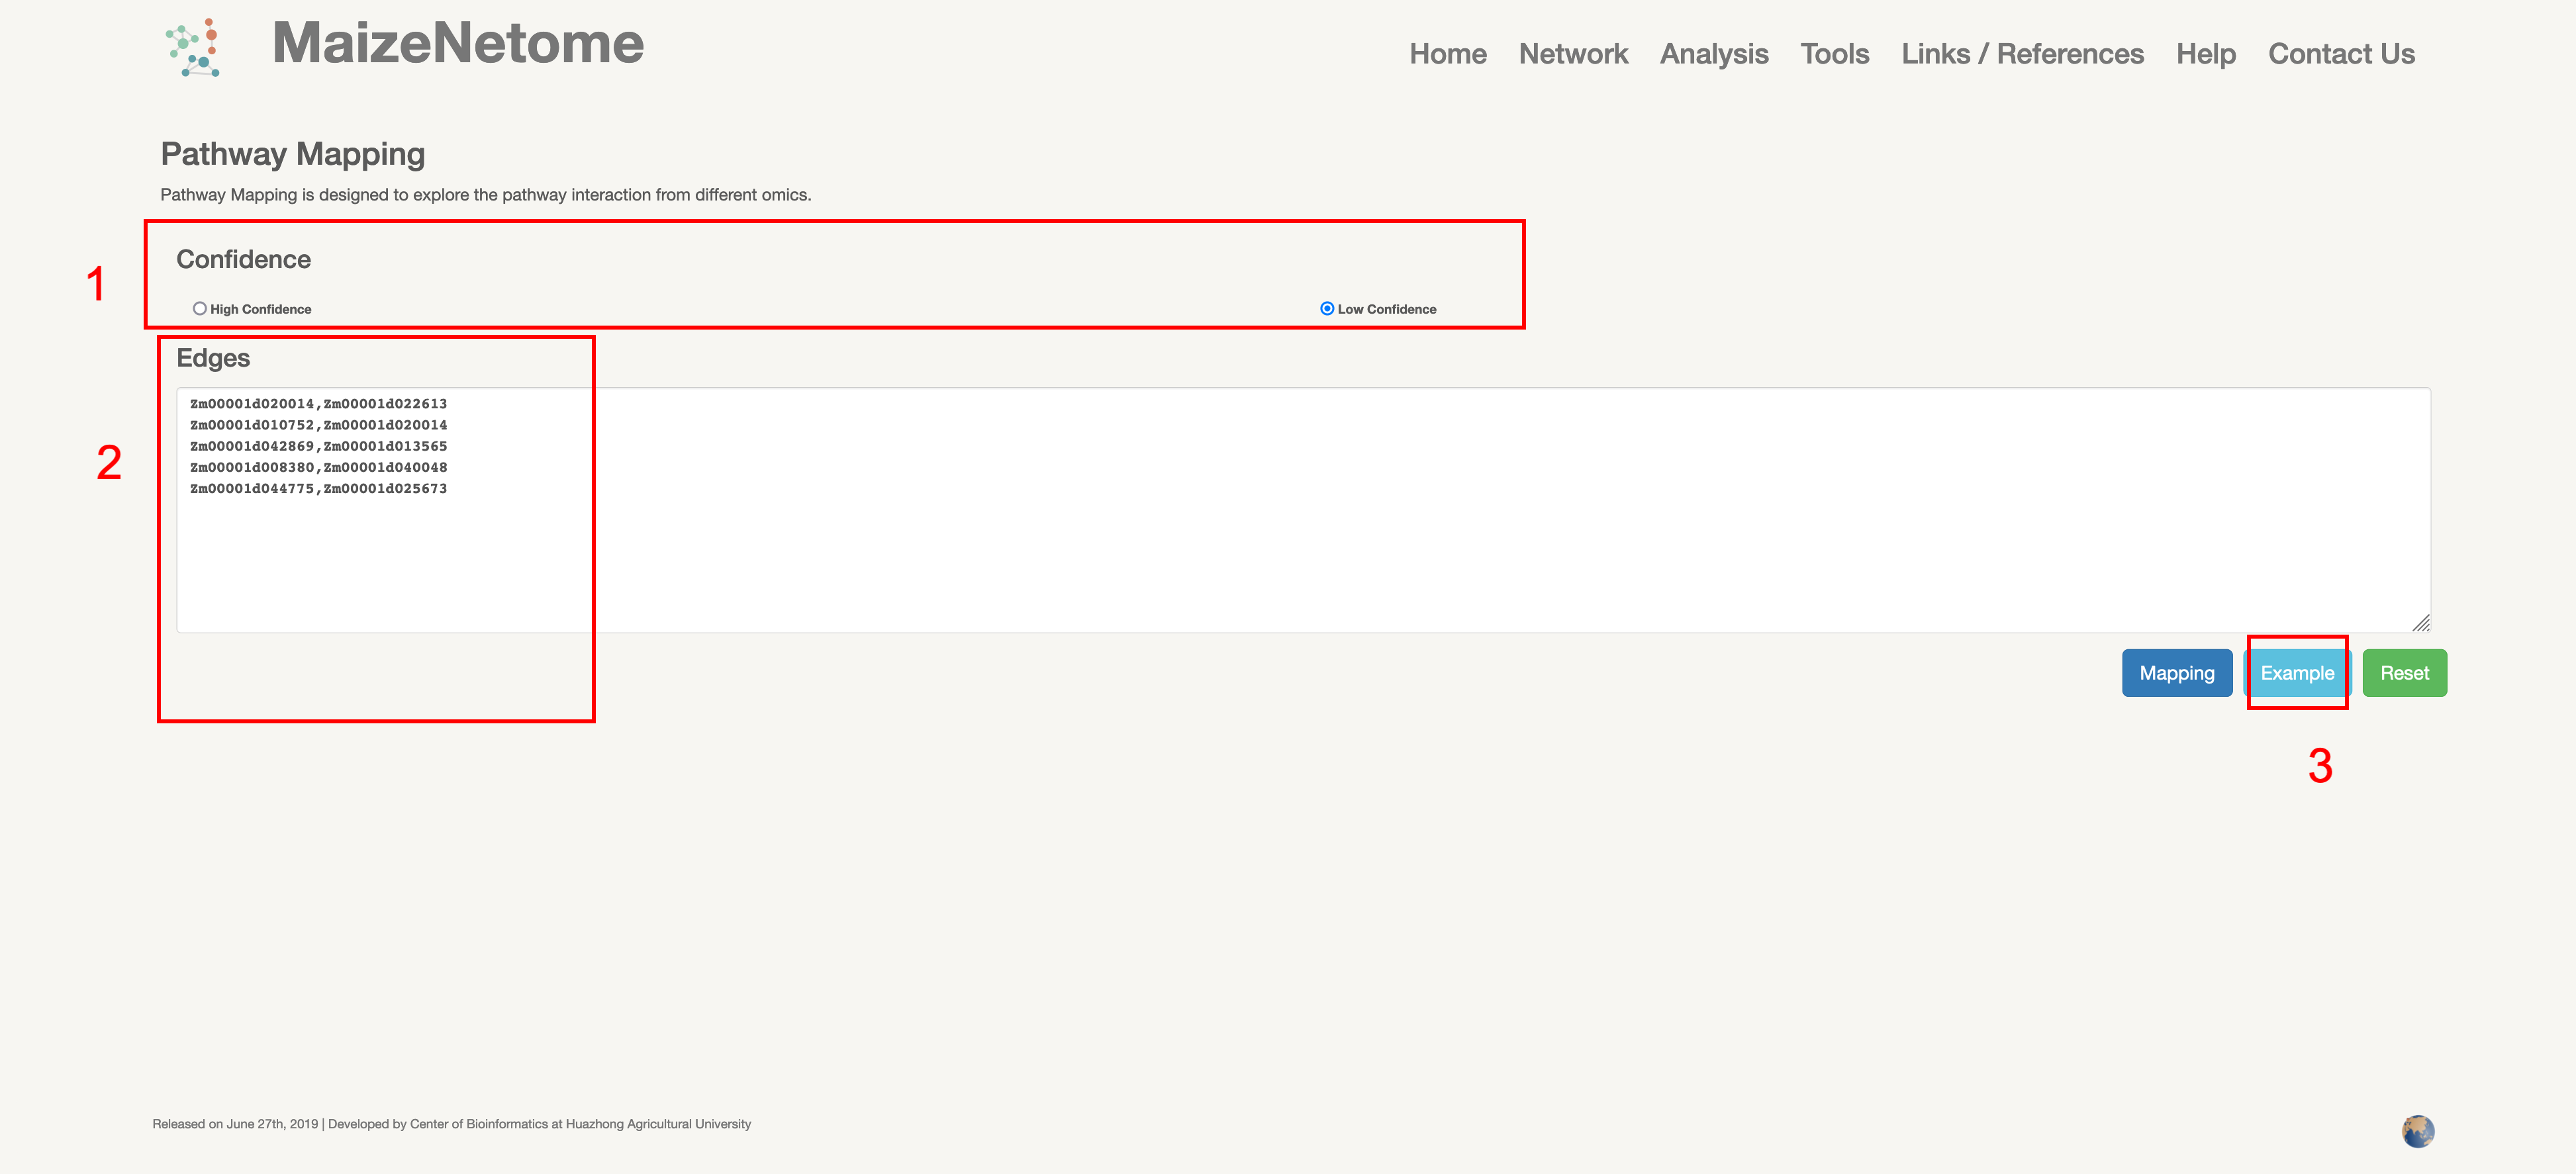
Pathway Mapping is designed to explore the pathway interaction from different omics.
1. Red box 1: Users can choose network confidence. 2. Red box 2: Enter the elements of the interaction (examples: element 1, element 2) 3. Red box 3: Click to see examples of the input.
1. Red box 1: blue indicates the interactions with evidence, green is without evidence, and yellow is the predicted interactions. 2. Red box 2: Evidence of interactions in various networks. Note: 1 is the value of direct interaction, 2 indirect interaction (the existence of an intermediate element with which to interact) 3. Red box 3: Predicted potential interactions. Note: 1 is the value of direct interaction, 2 indirect interaction (the existence of an intermediate element with which to interact)

We develop eight essential tools for users to explore our network data: BLAST, GBrowse, Element Fetch, Element Search, Module Search, Module Hit, Network Creation, and Network Comparison. These tools allow users to access our network data as quickly as possible.
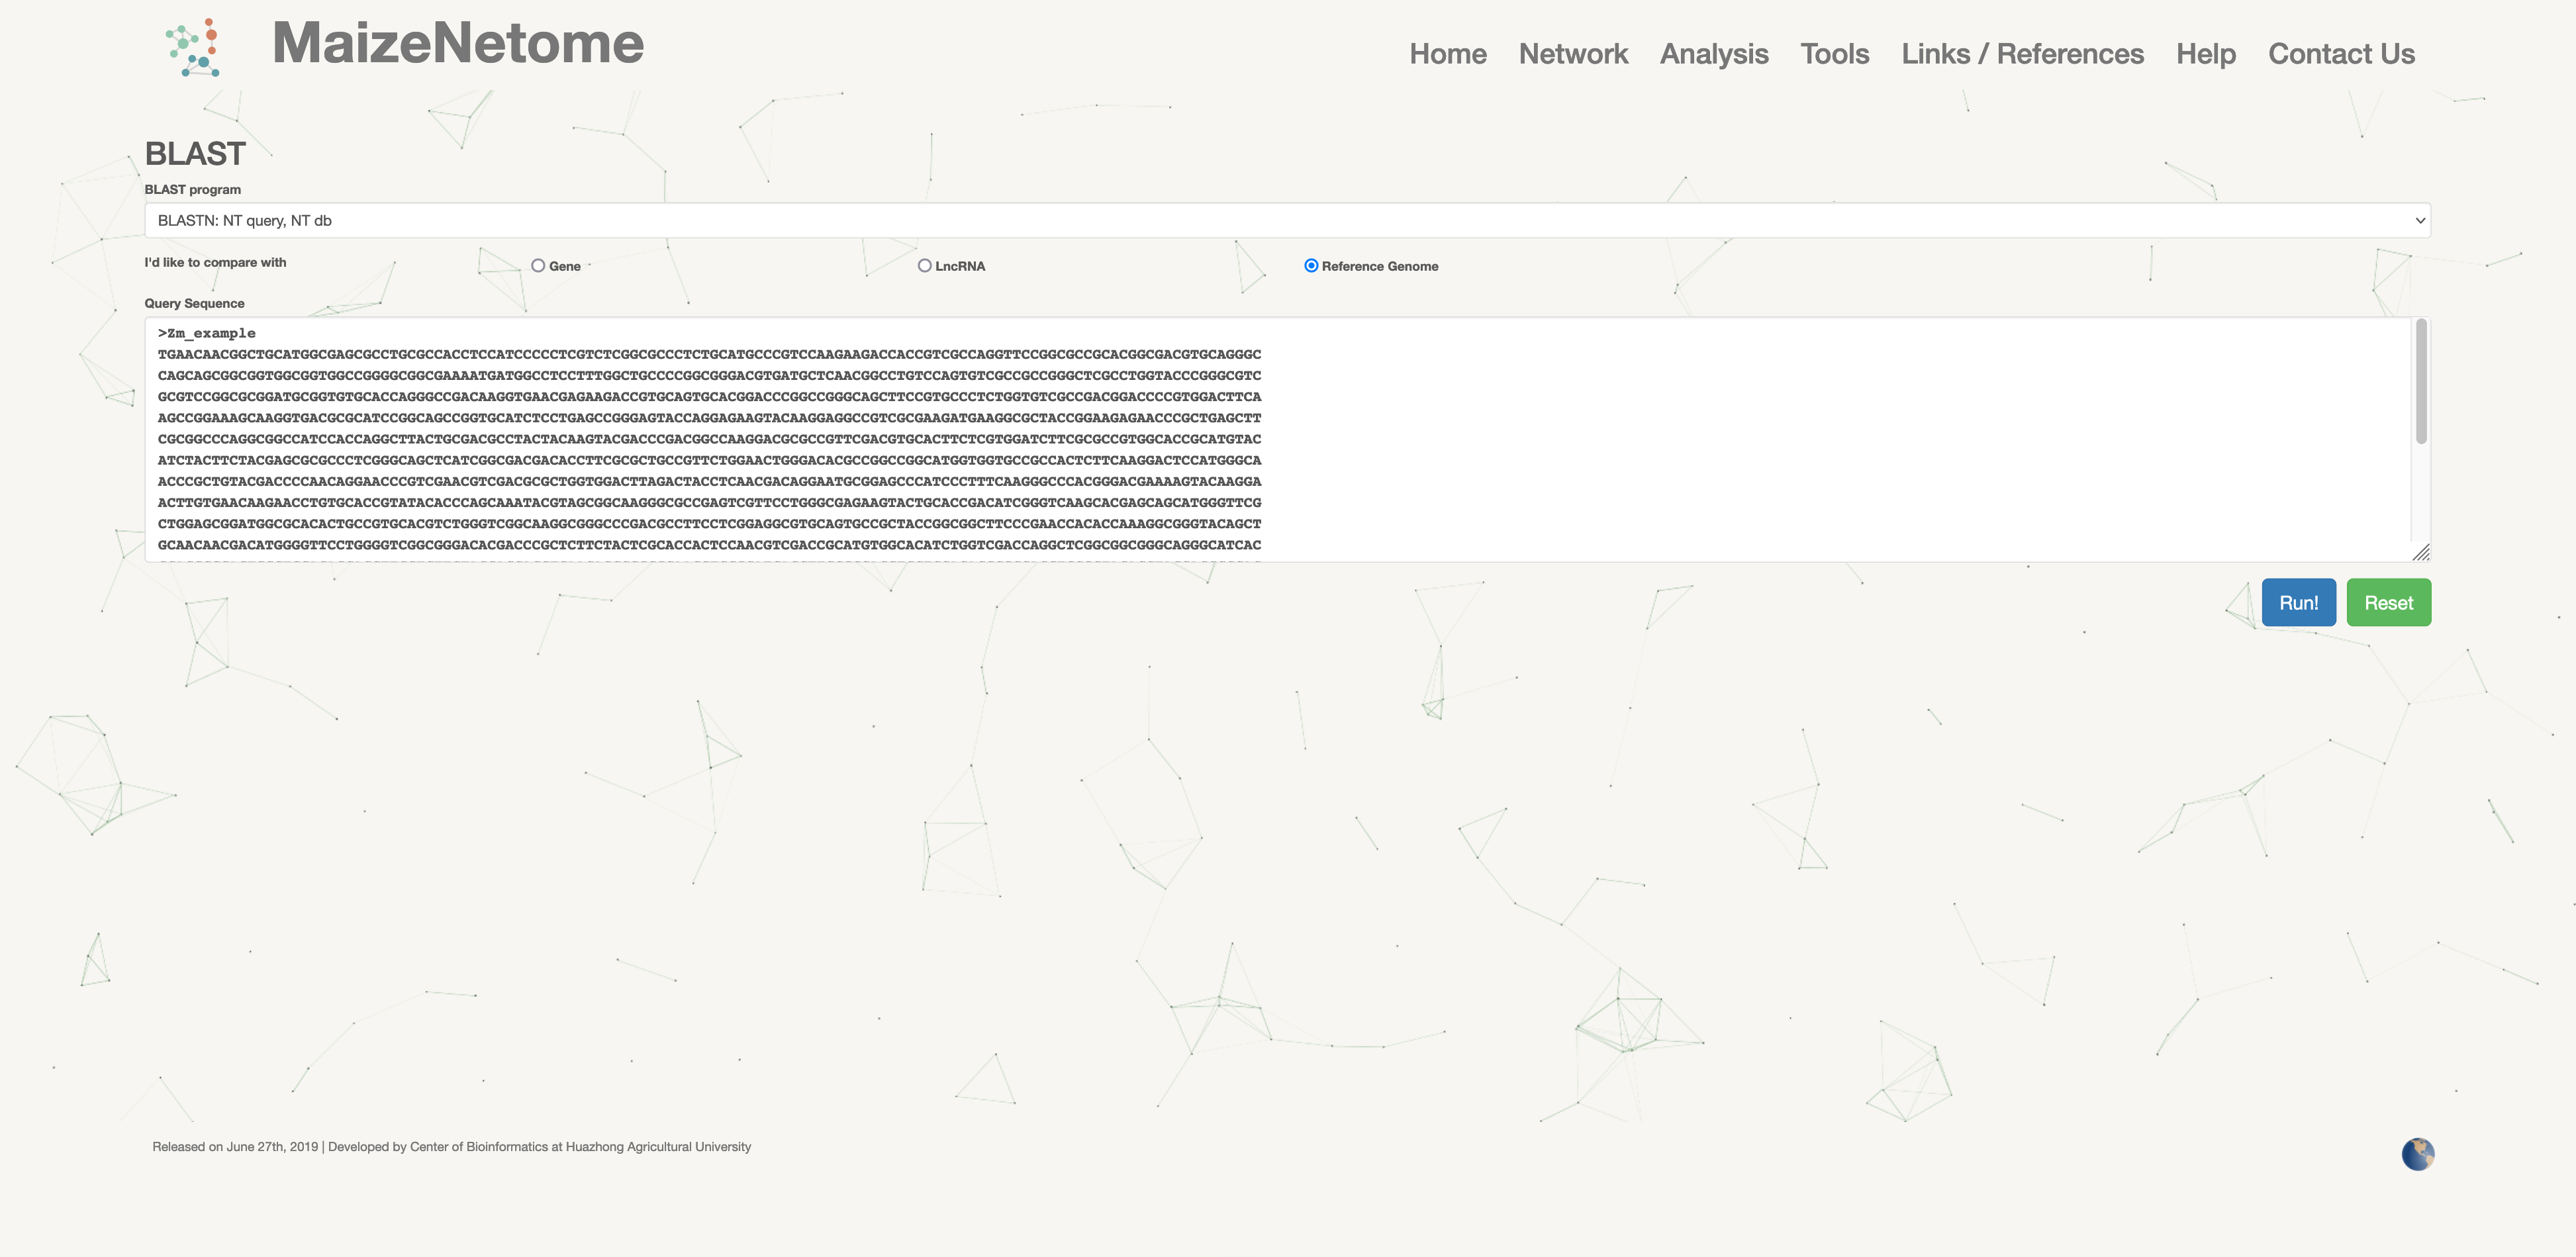
A known sequence is used to obtain the position of the Element ID alignment on the genome.
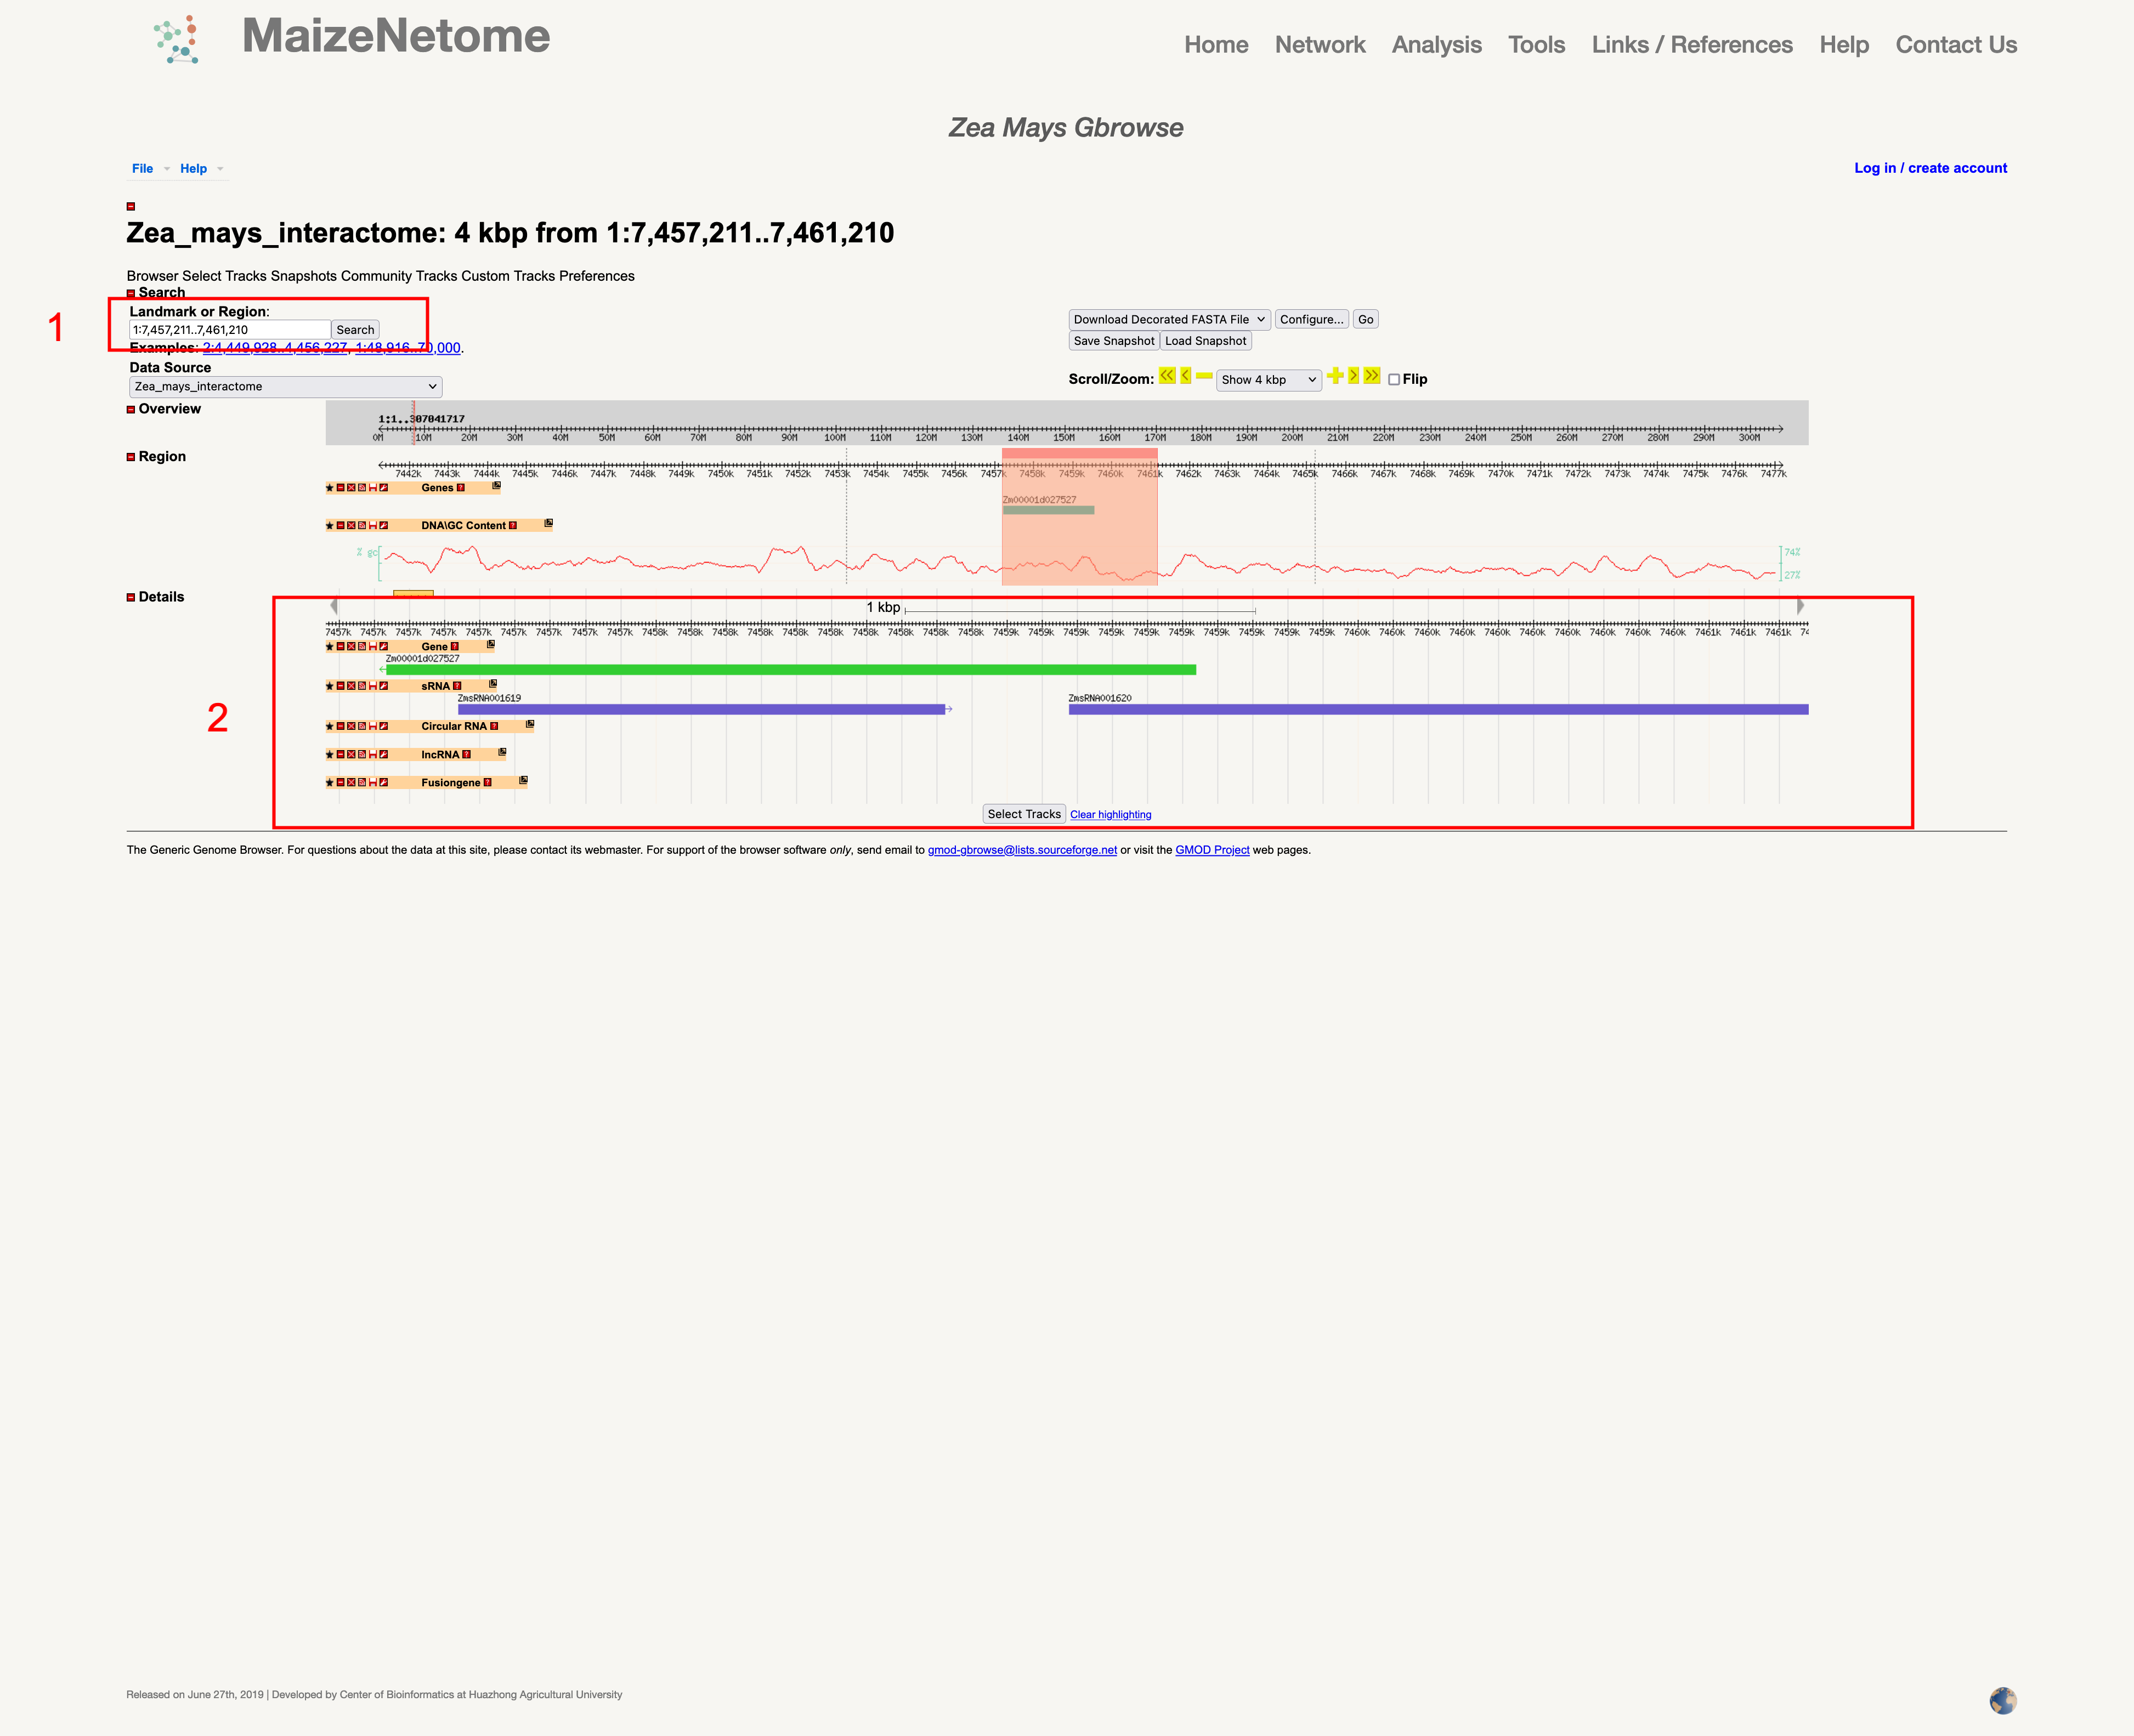
The GBrowse can be used to obtain the position on the genome of genomic elements.
1. Red box 1: Enter the genome interval (examples: chromosome: start-end) as shown in the picture. 2. Red box 2: The position of different elements in the interval.
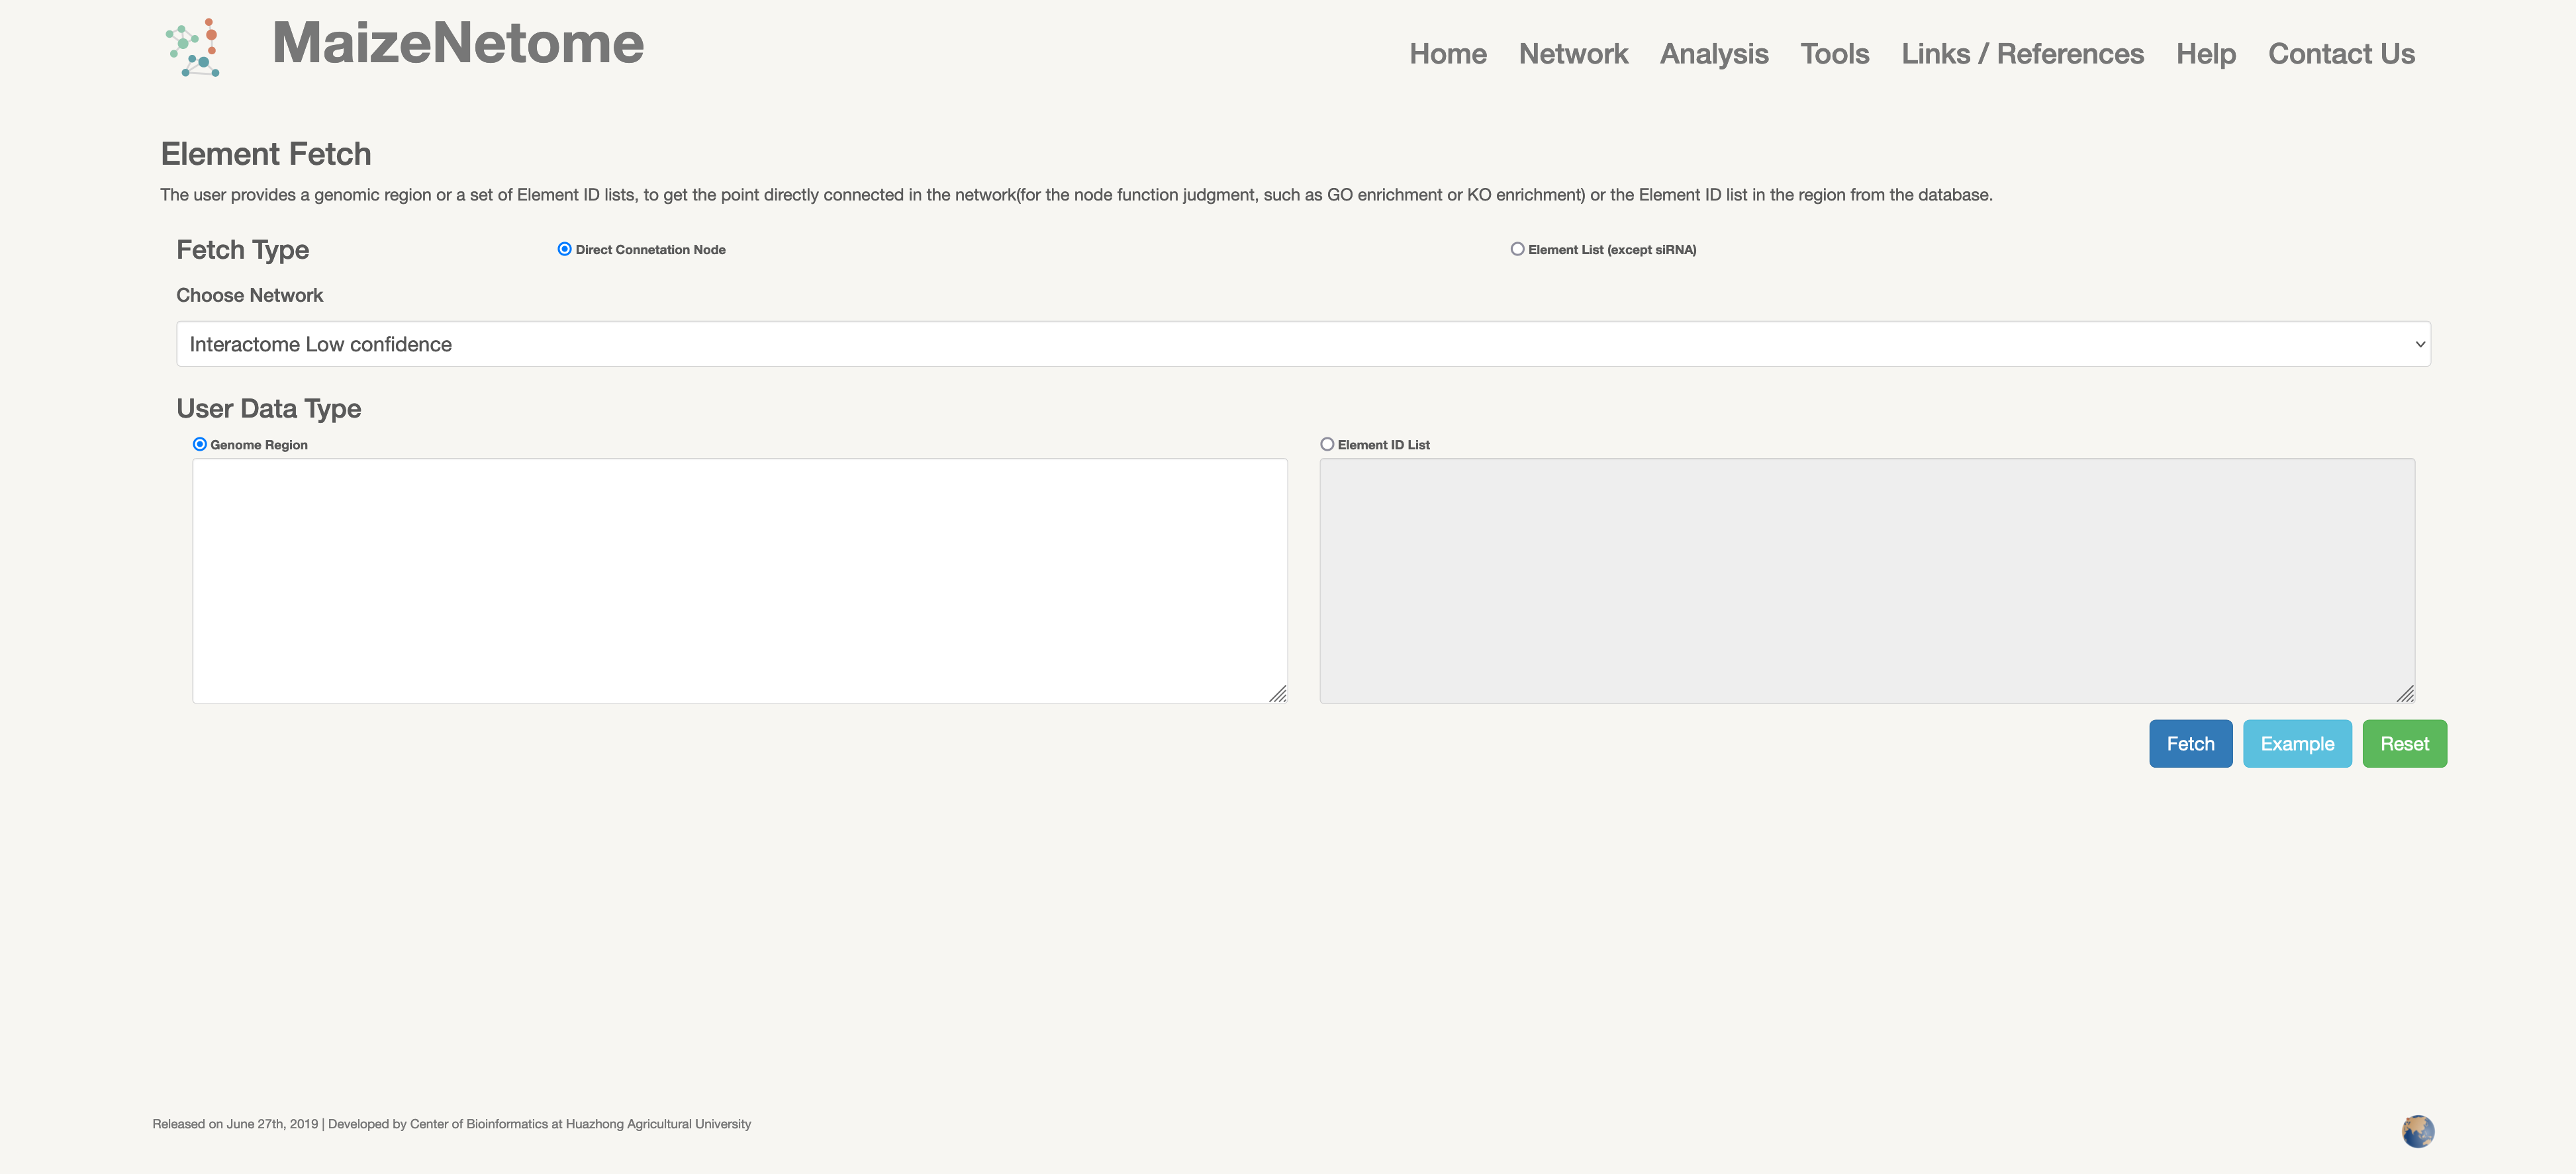
The users can provide a genomic region to get directly connected nodes in the network or the Element ID lists and provide an Element ID list to get directly connected nodes. The result is in tabular form (such as txt, CSV, excel, and XML downloads).
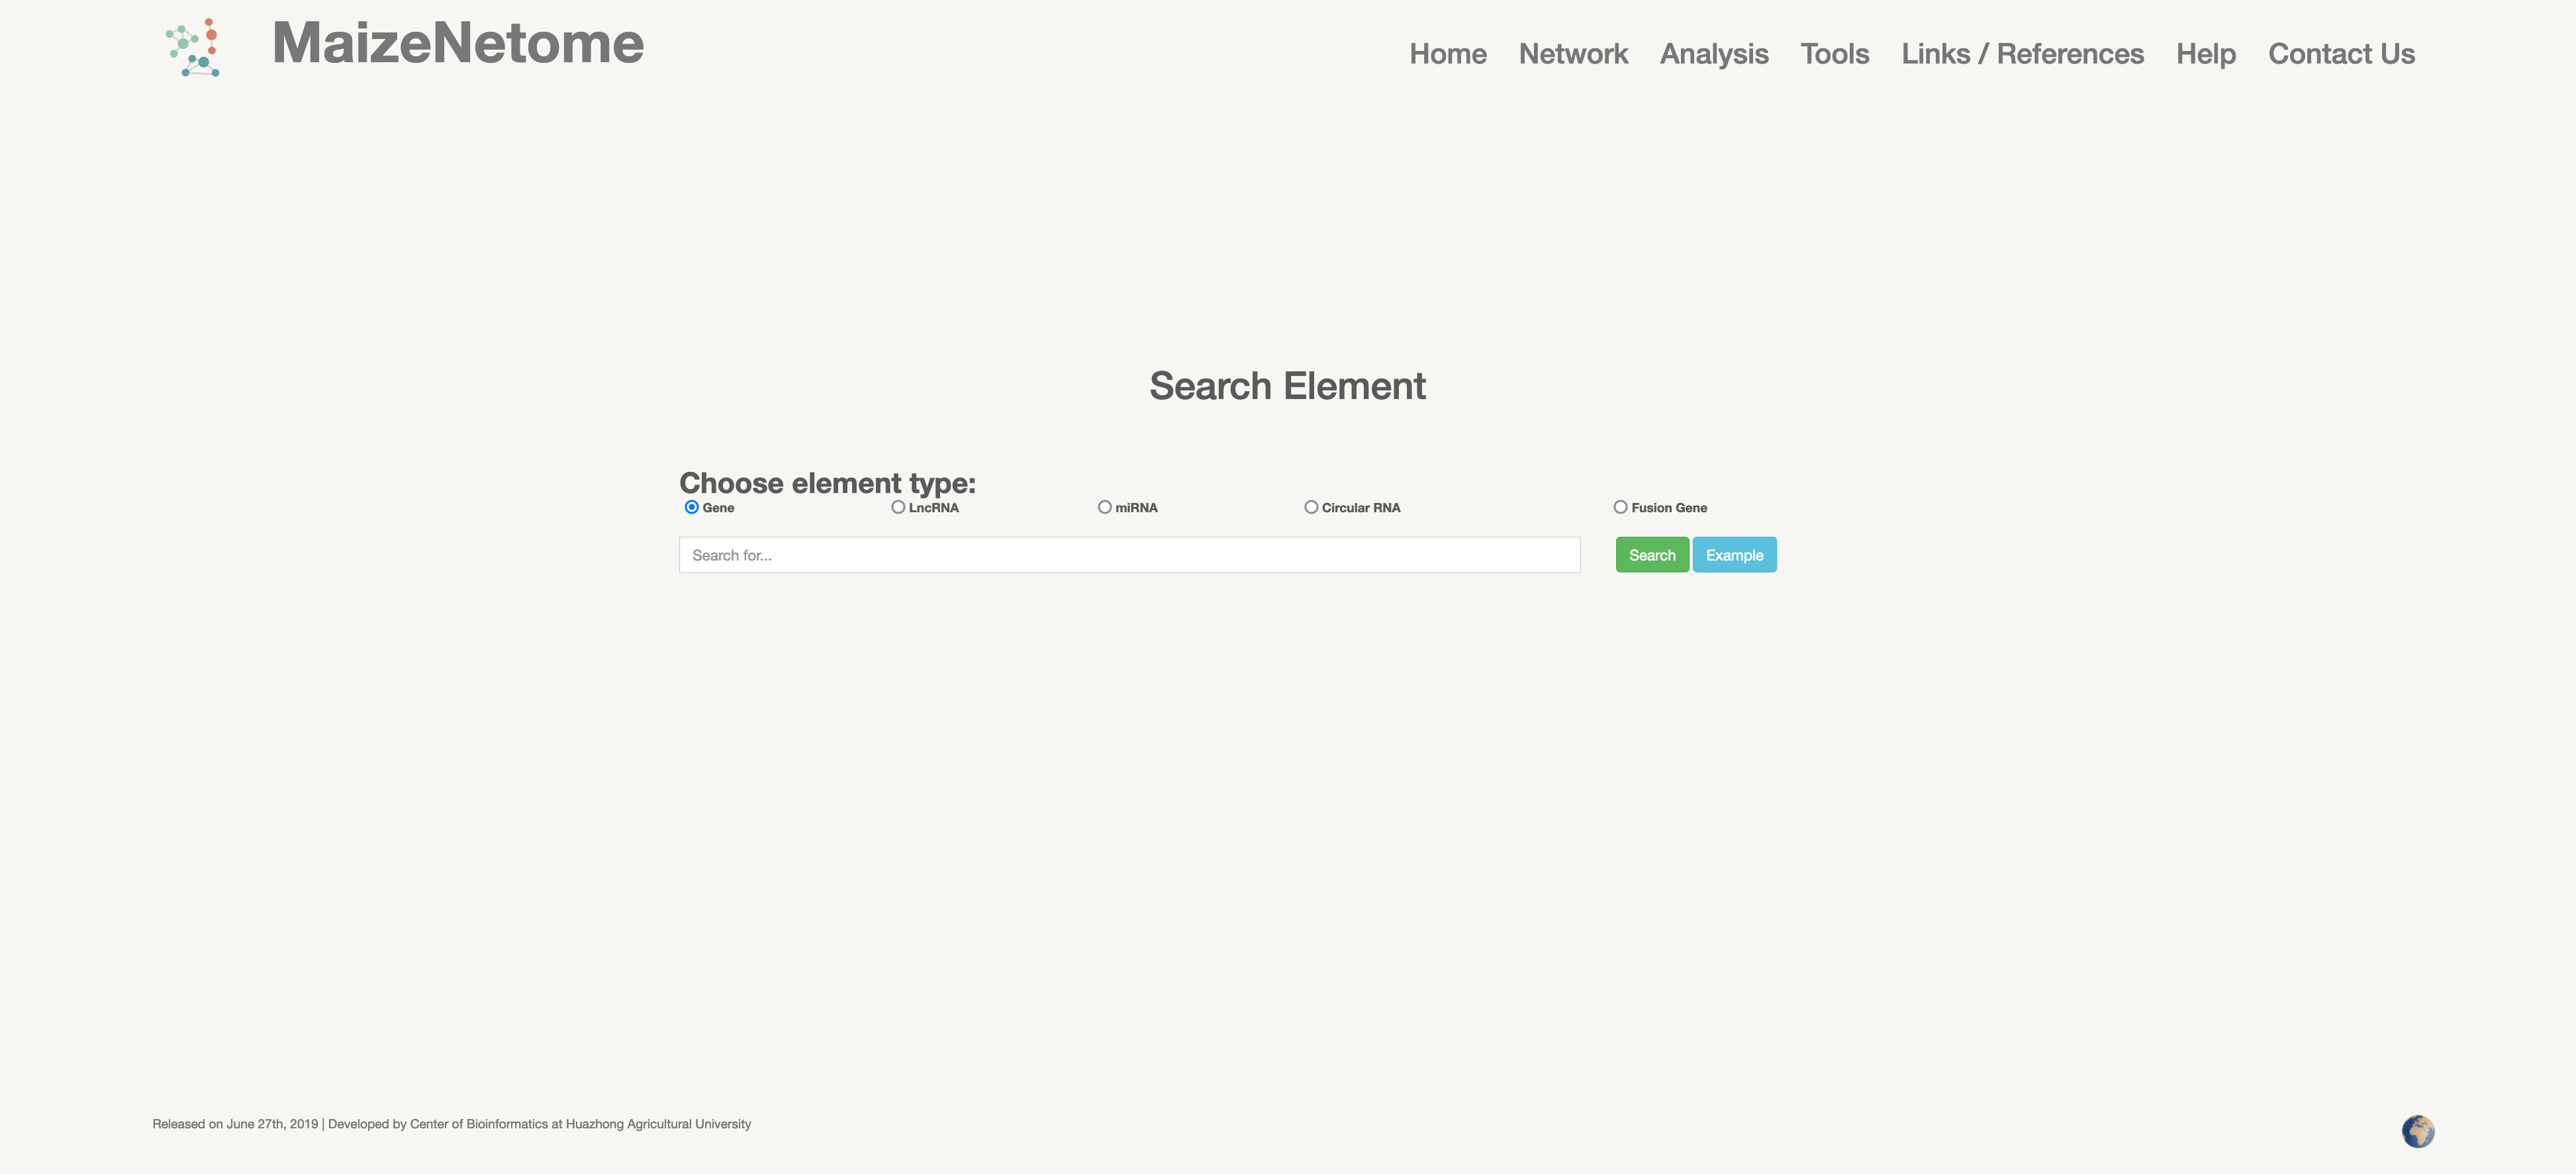
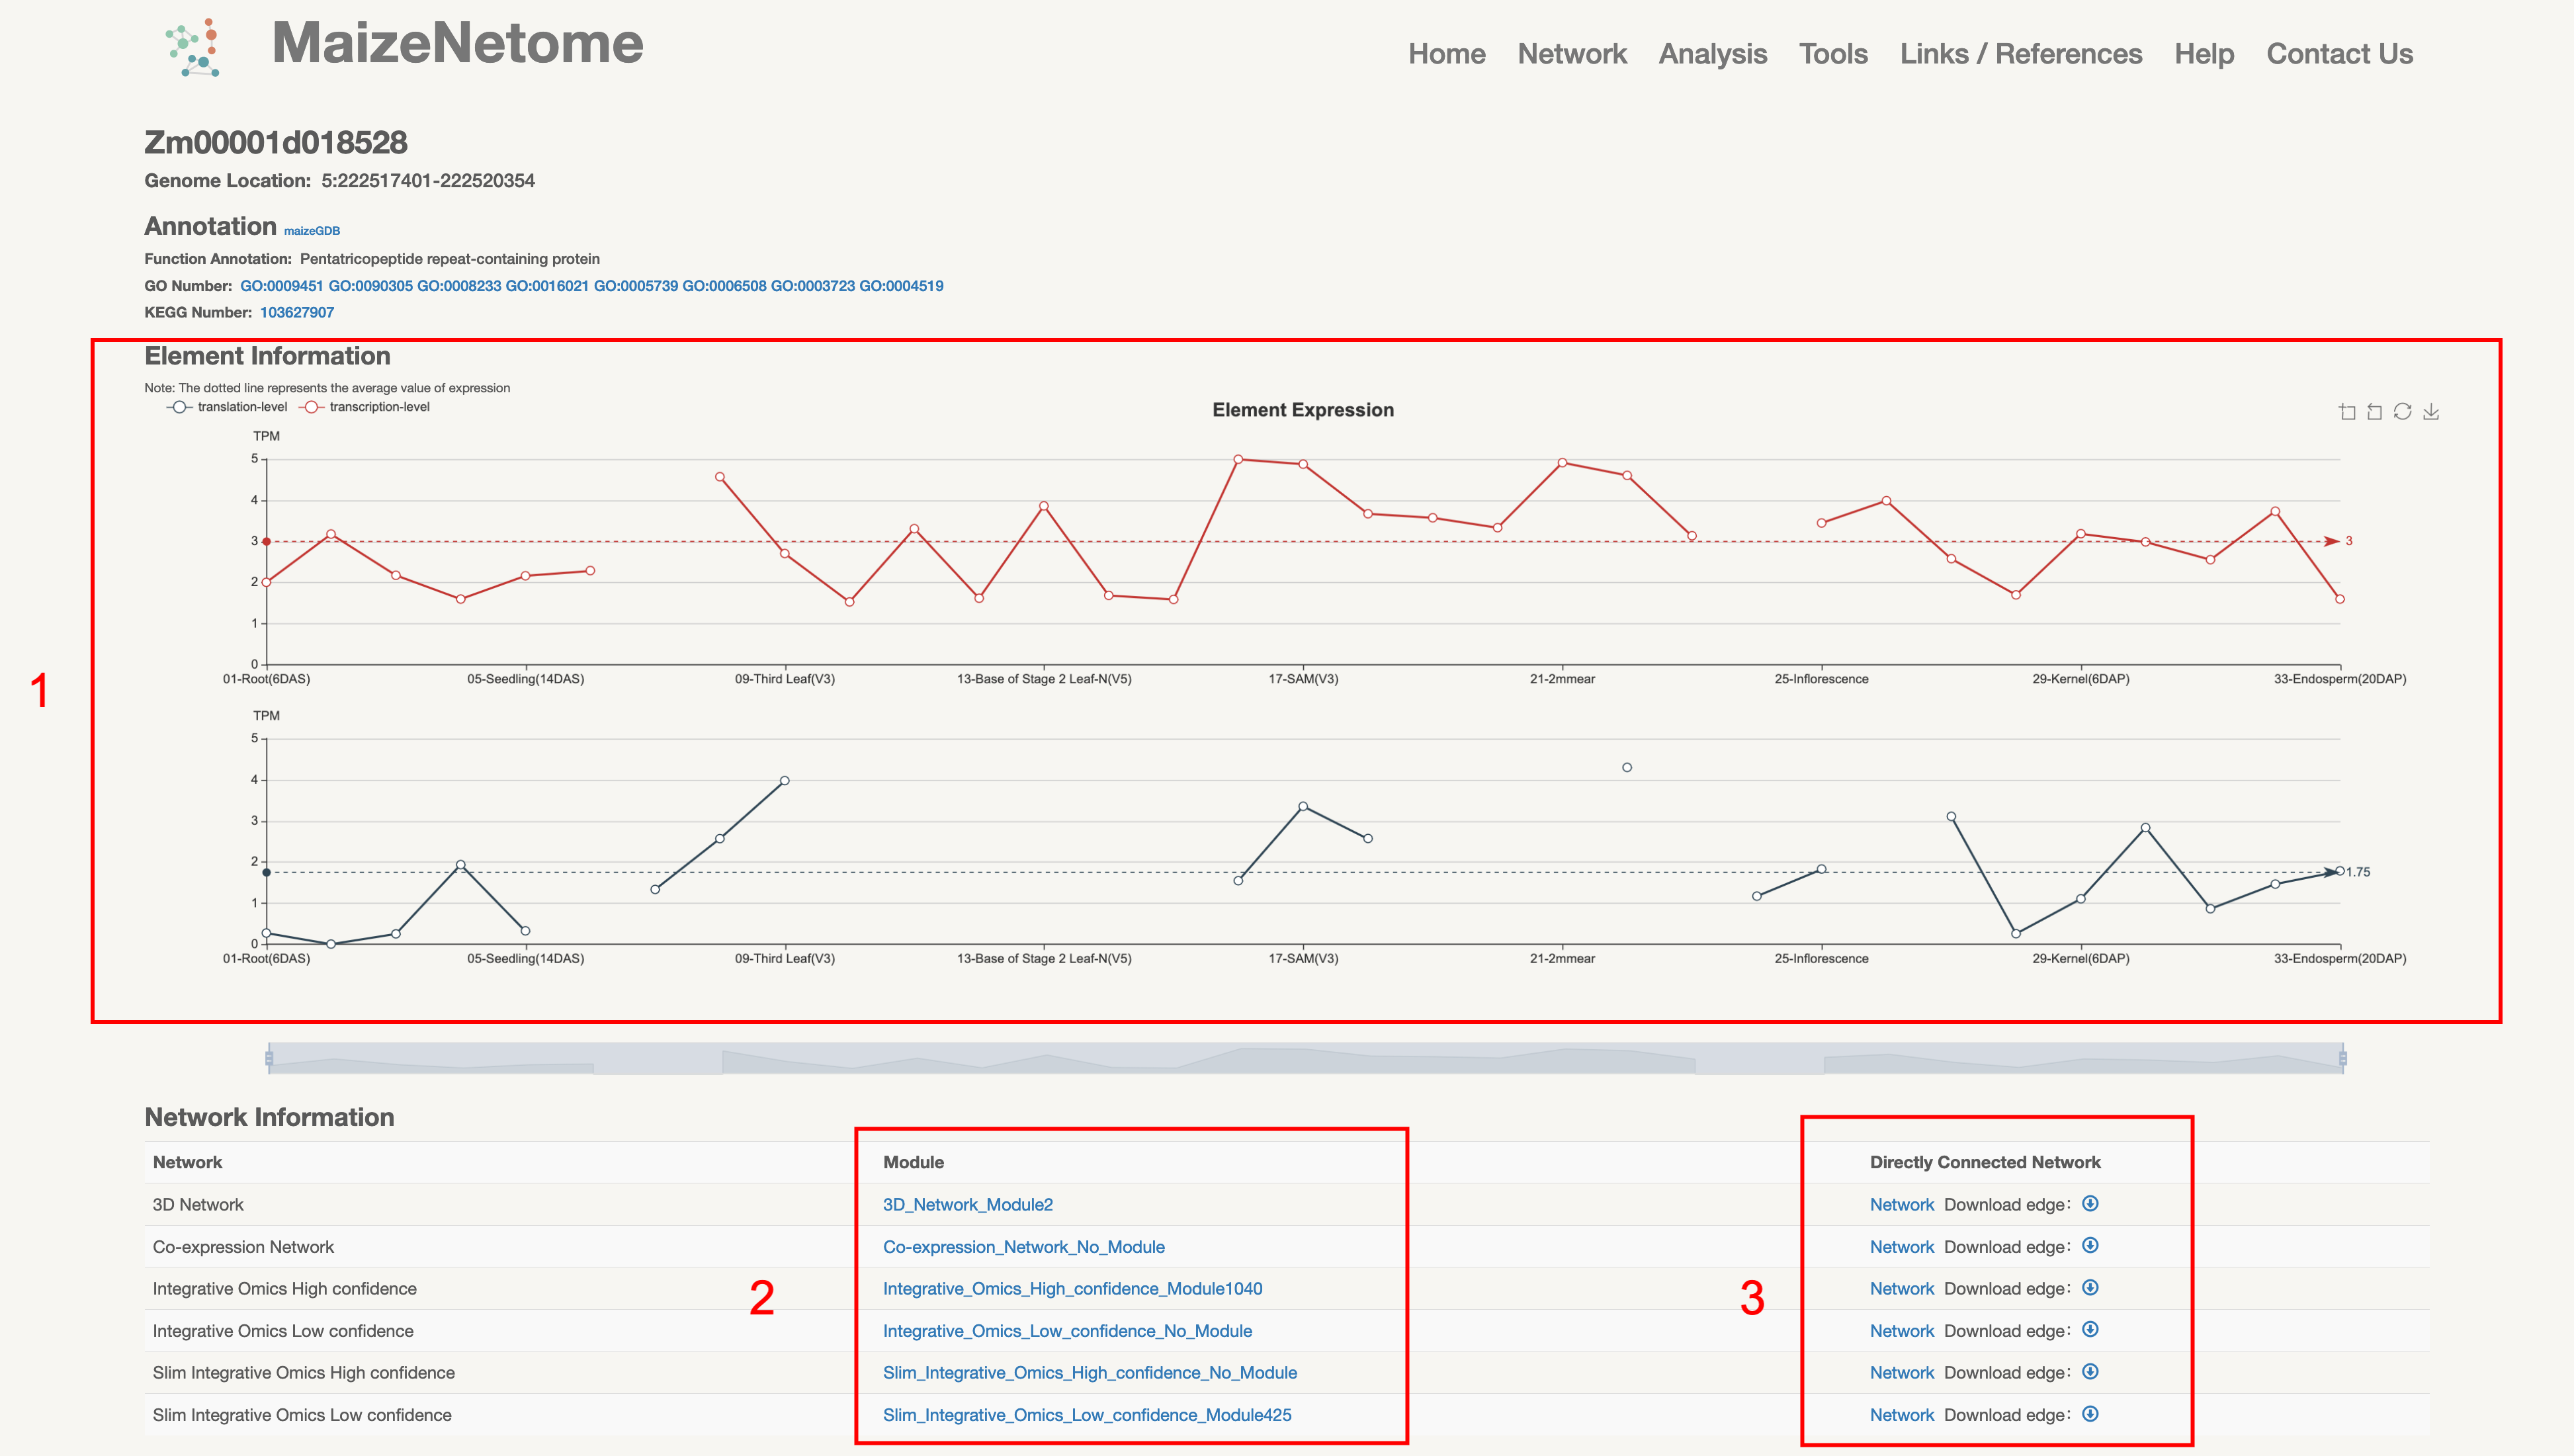
First, select the type of Element you are searching for. Then enter the searched Element ID, the microRNA module, and the gene module support the ID of the corn B73V4 version. The users can get the result including RNA-seq, Ribo-seq expression, and functional annotations, such as KO and GO. And it shows the module network and the directly connected network. Moreover, the result also provides download edges information of the network.
1. Red box 1: Expression at the transcriptional and translational levels. 2. Red box 2: Module Network. 3. Direct Connected Network.
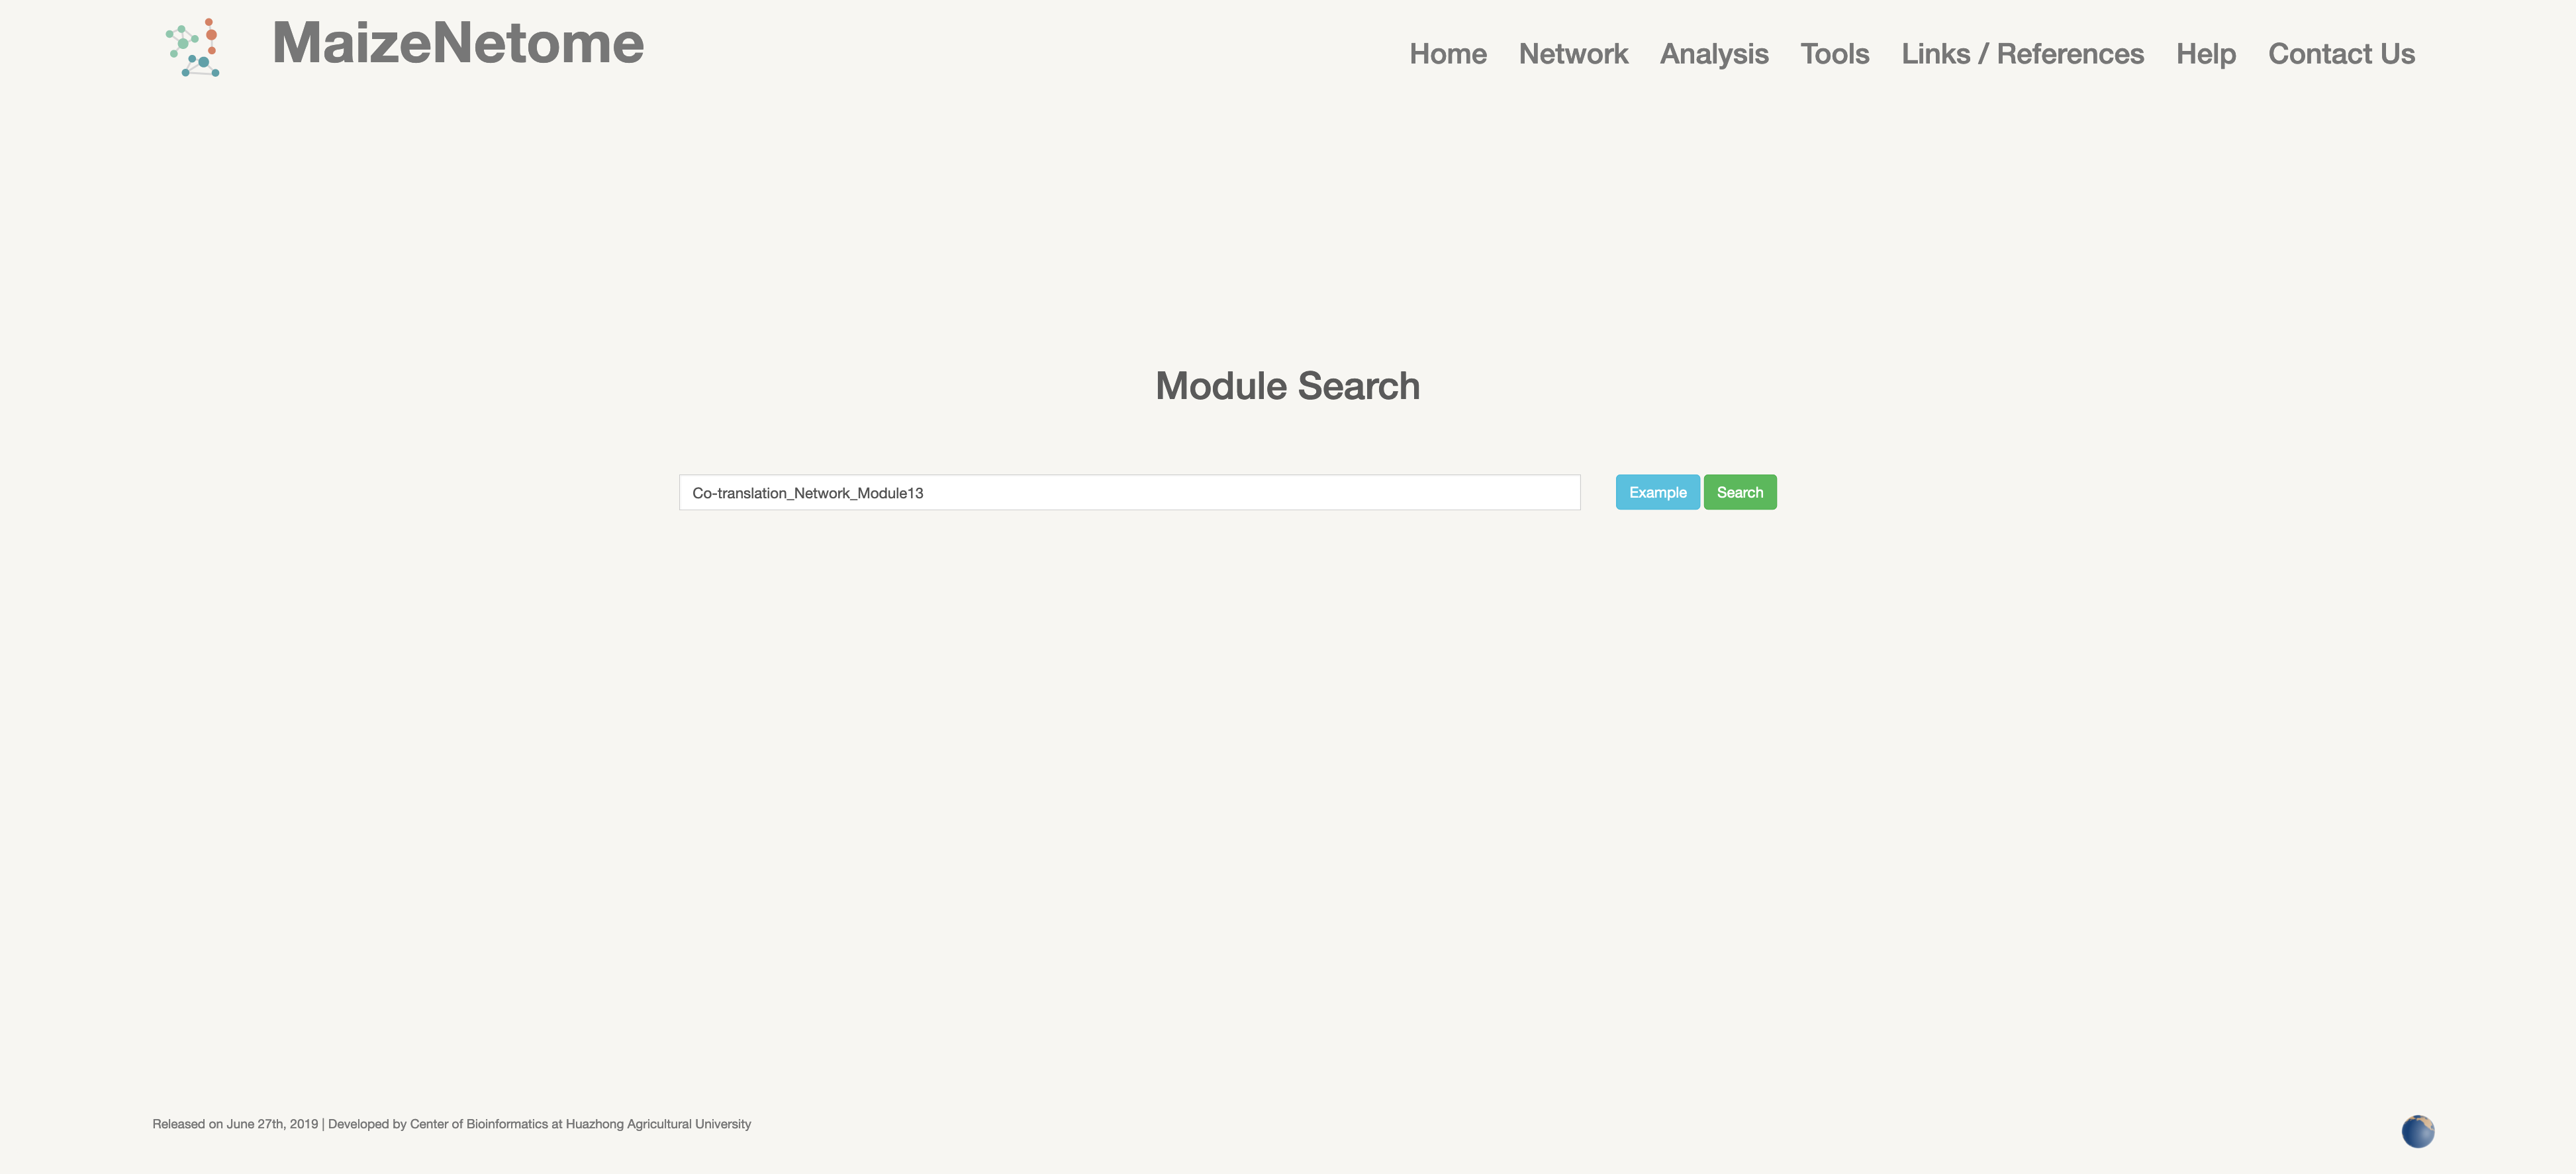
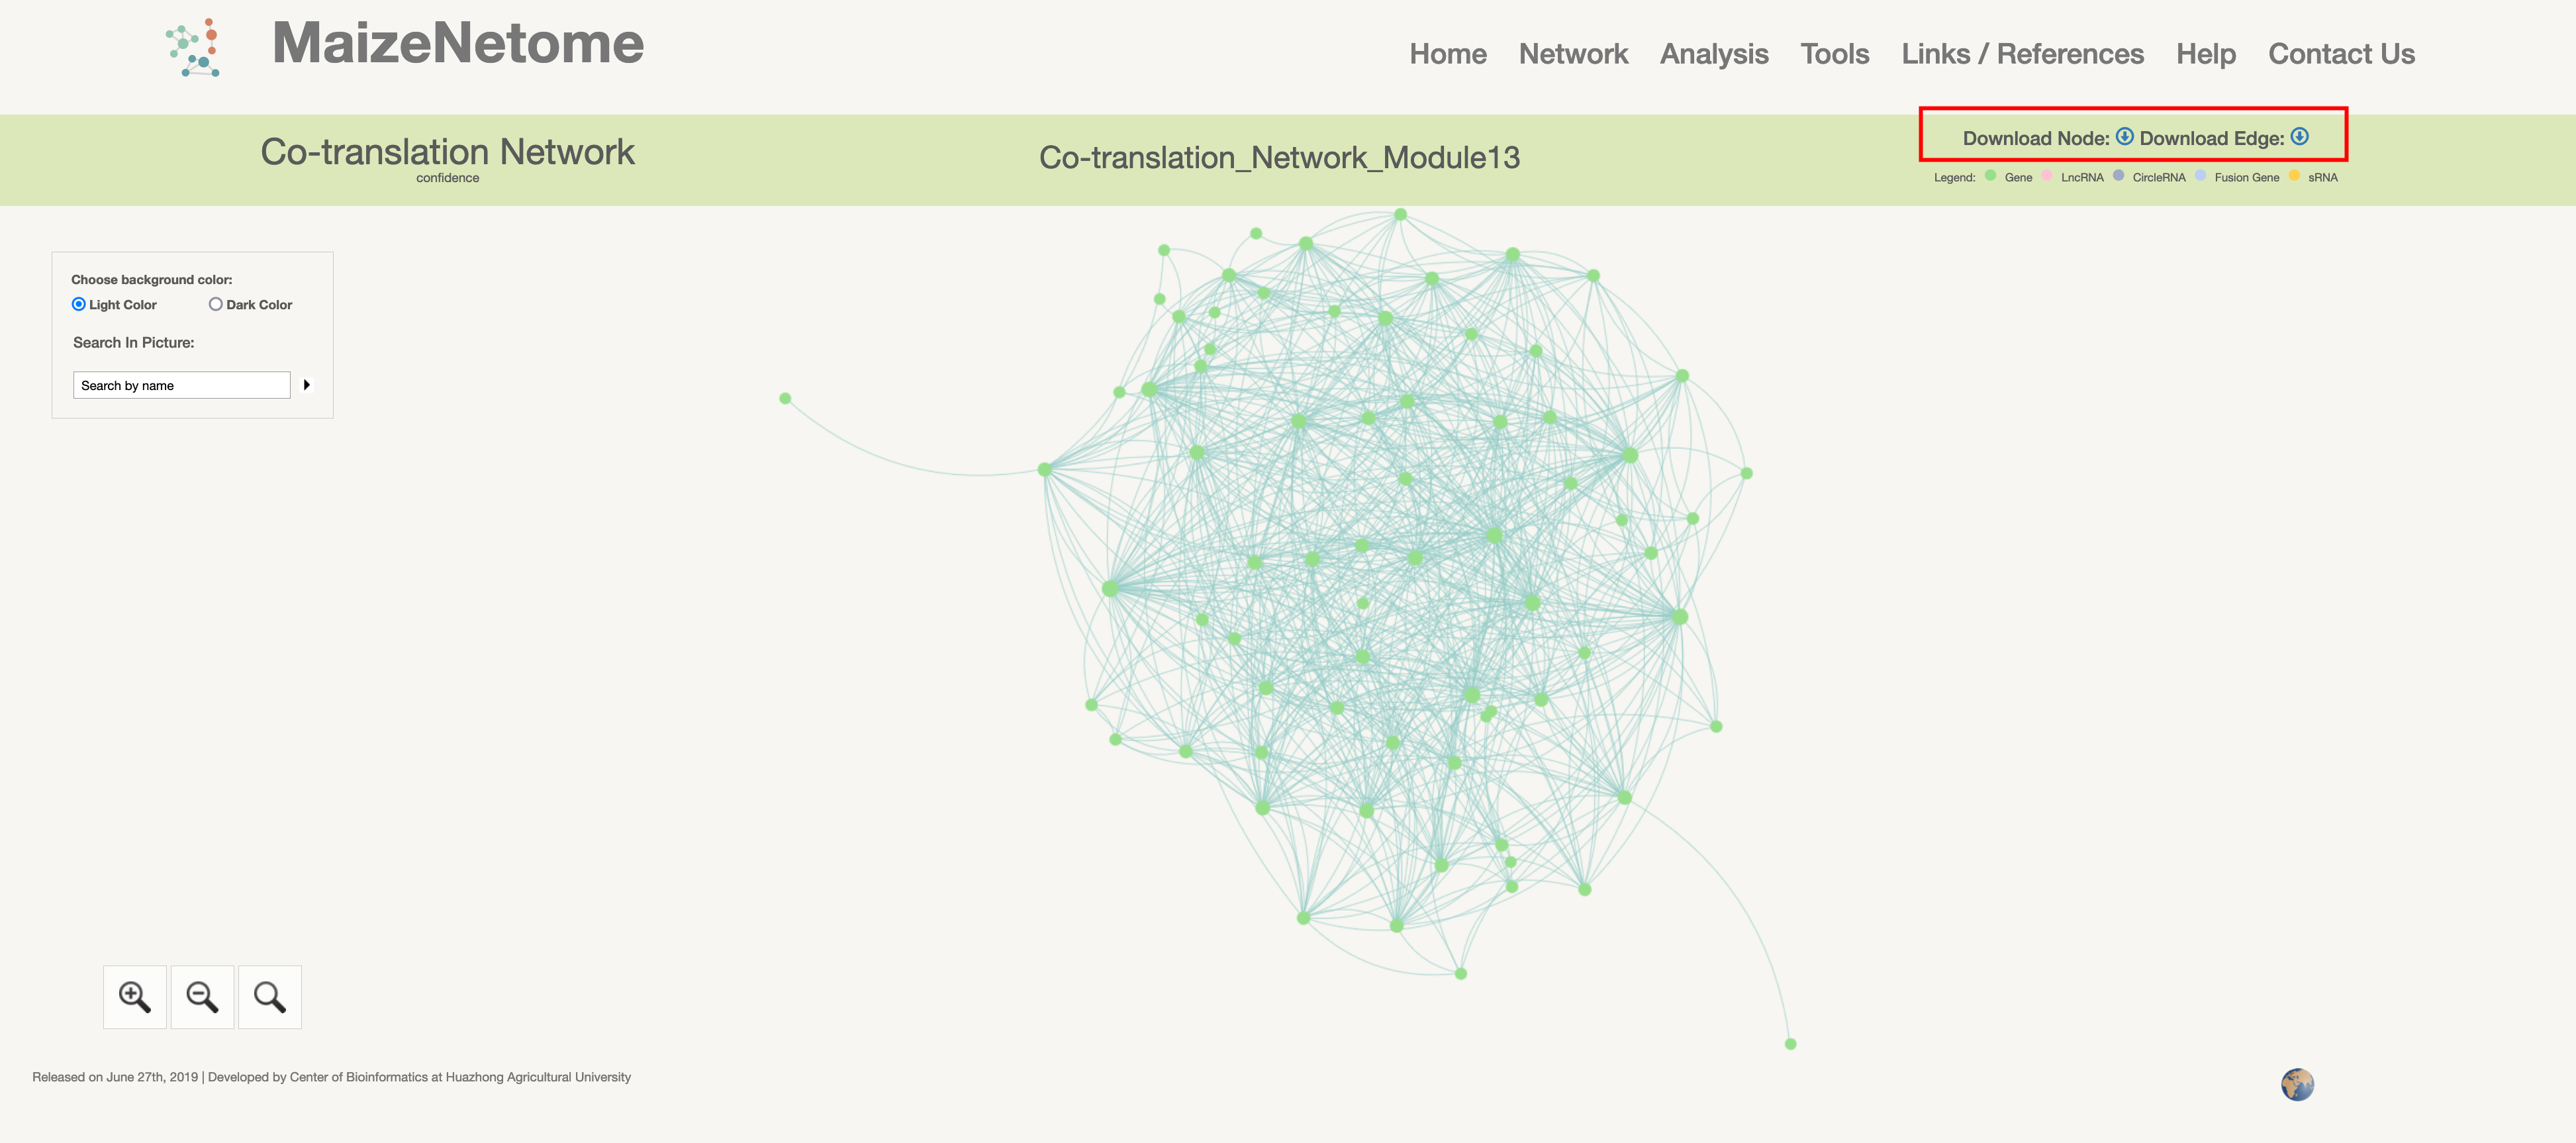
By Returning the network of the searched module based on our module name, users can download module nodes and edge data in the results page. And these data can be applied to gephi to redraw network distribution.
Use Fisher's test to determine if the provided Element ID is enriched in the associated module. To avoid enrichment in a large number of small modules, users can set the minimum number of hits to this module node. The default value is 3 (the minimum module in the network is five nodes)

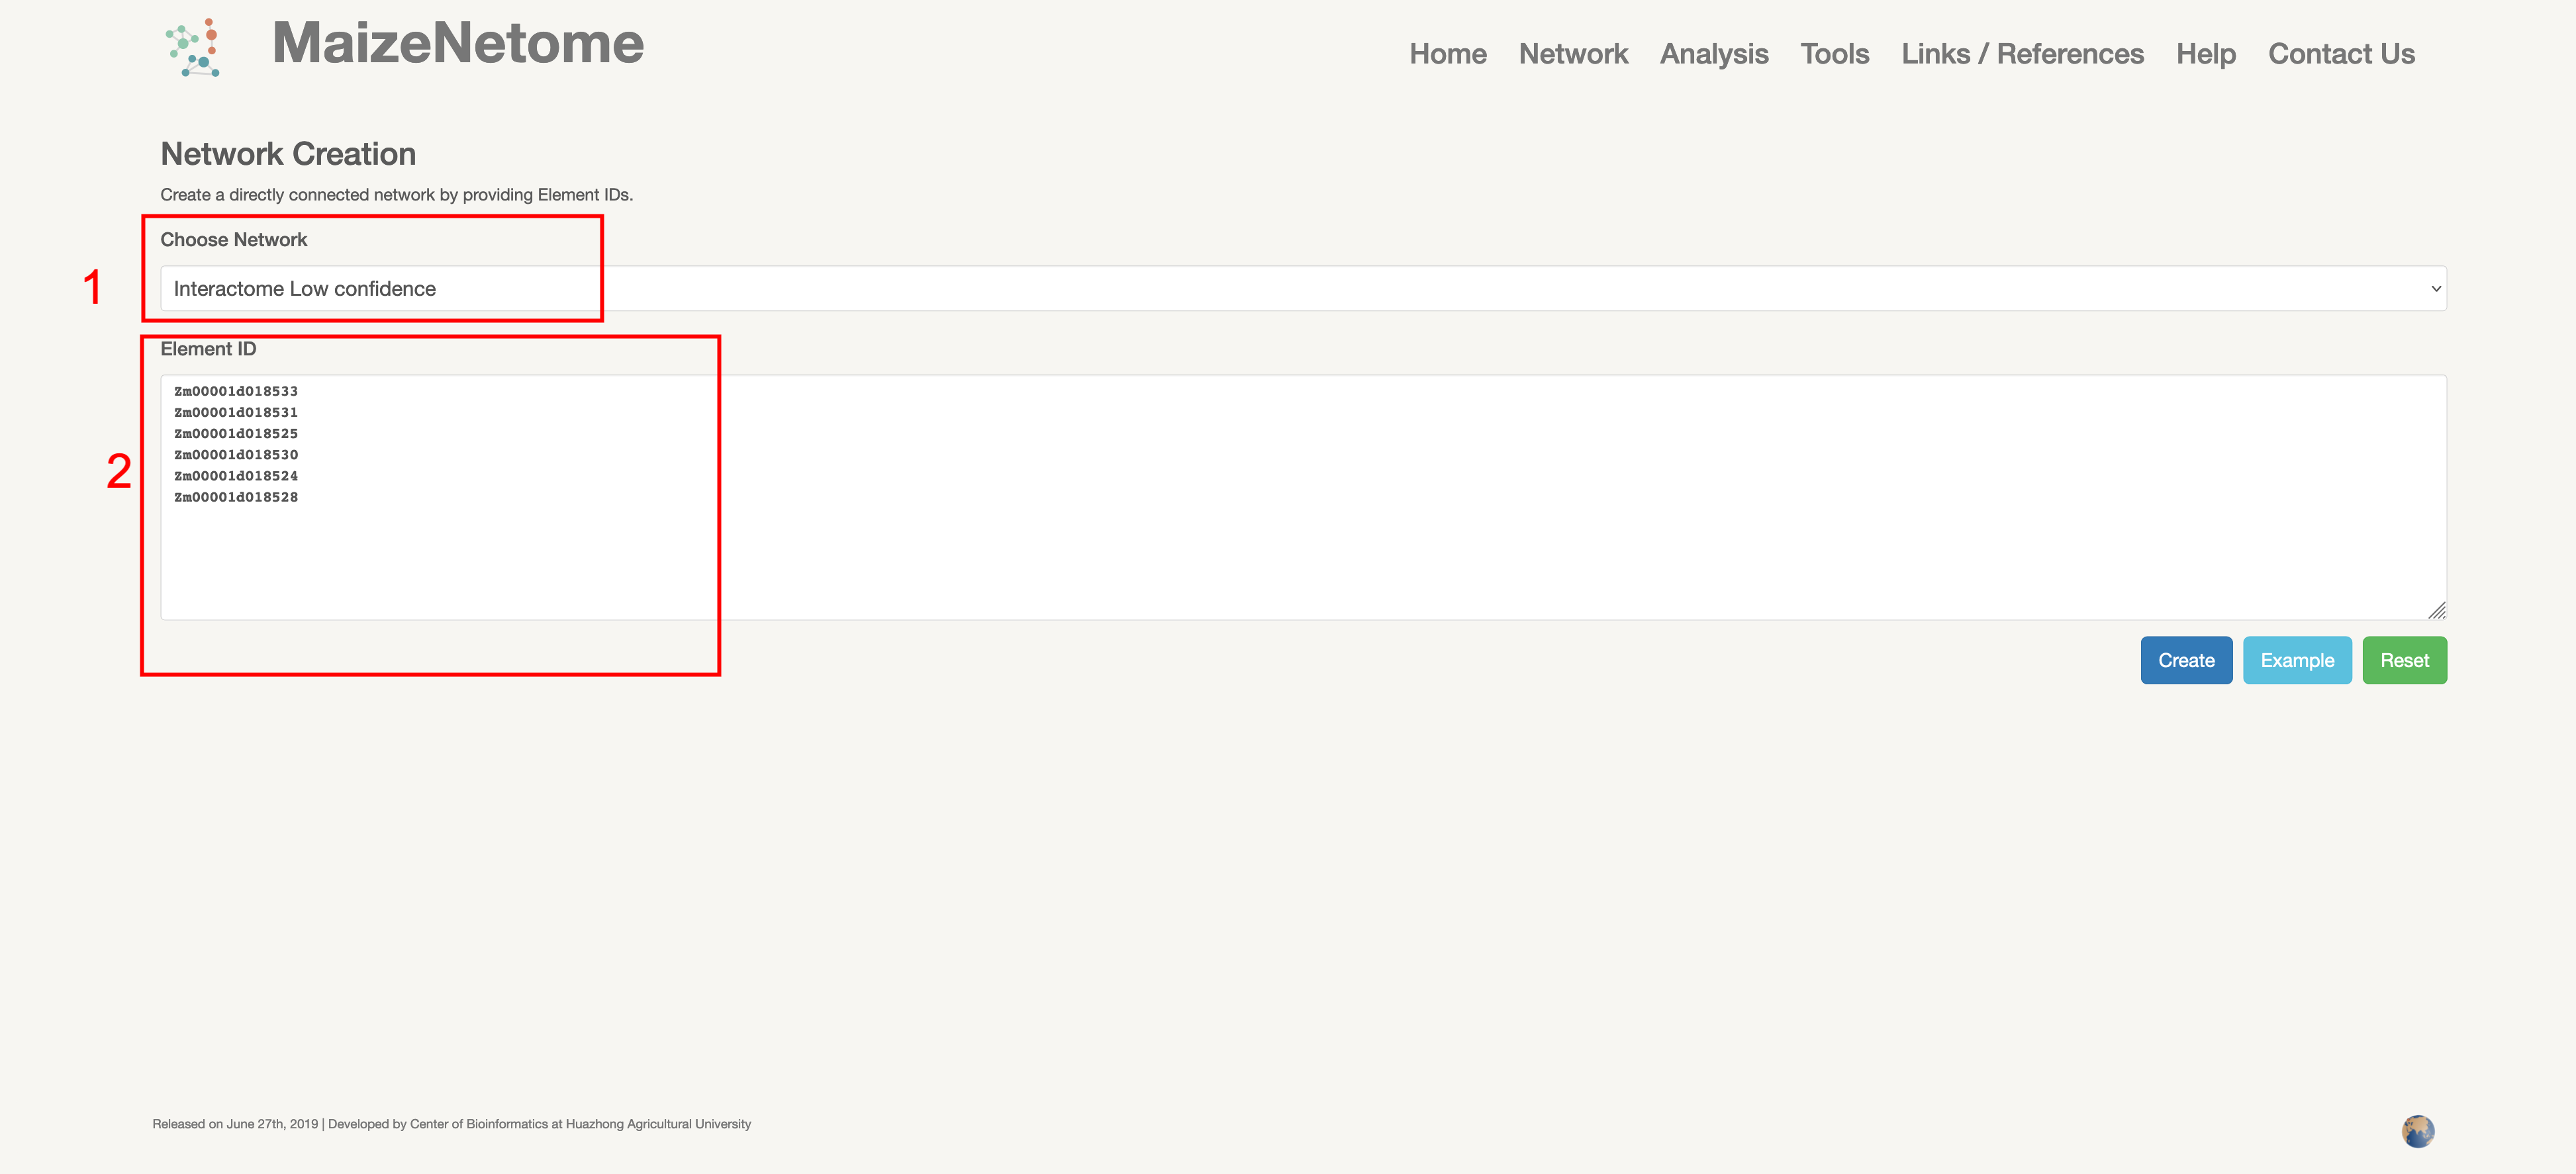
Create a directly connected network by providing Element IDs. Users can use the space bar or tab to search for the required ID or use a new line to split. The search return page gets a de-redundant network that directly uses the ID to connect to the network. Note that as the number of point input increases, the calculation of the network layout will also increase, and the computing resources consumed will be more.
1. Red box 1: Users can choose network type. 2. Red box 2: Input box for interested elements.
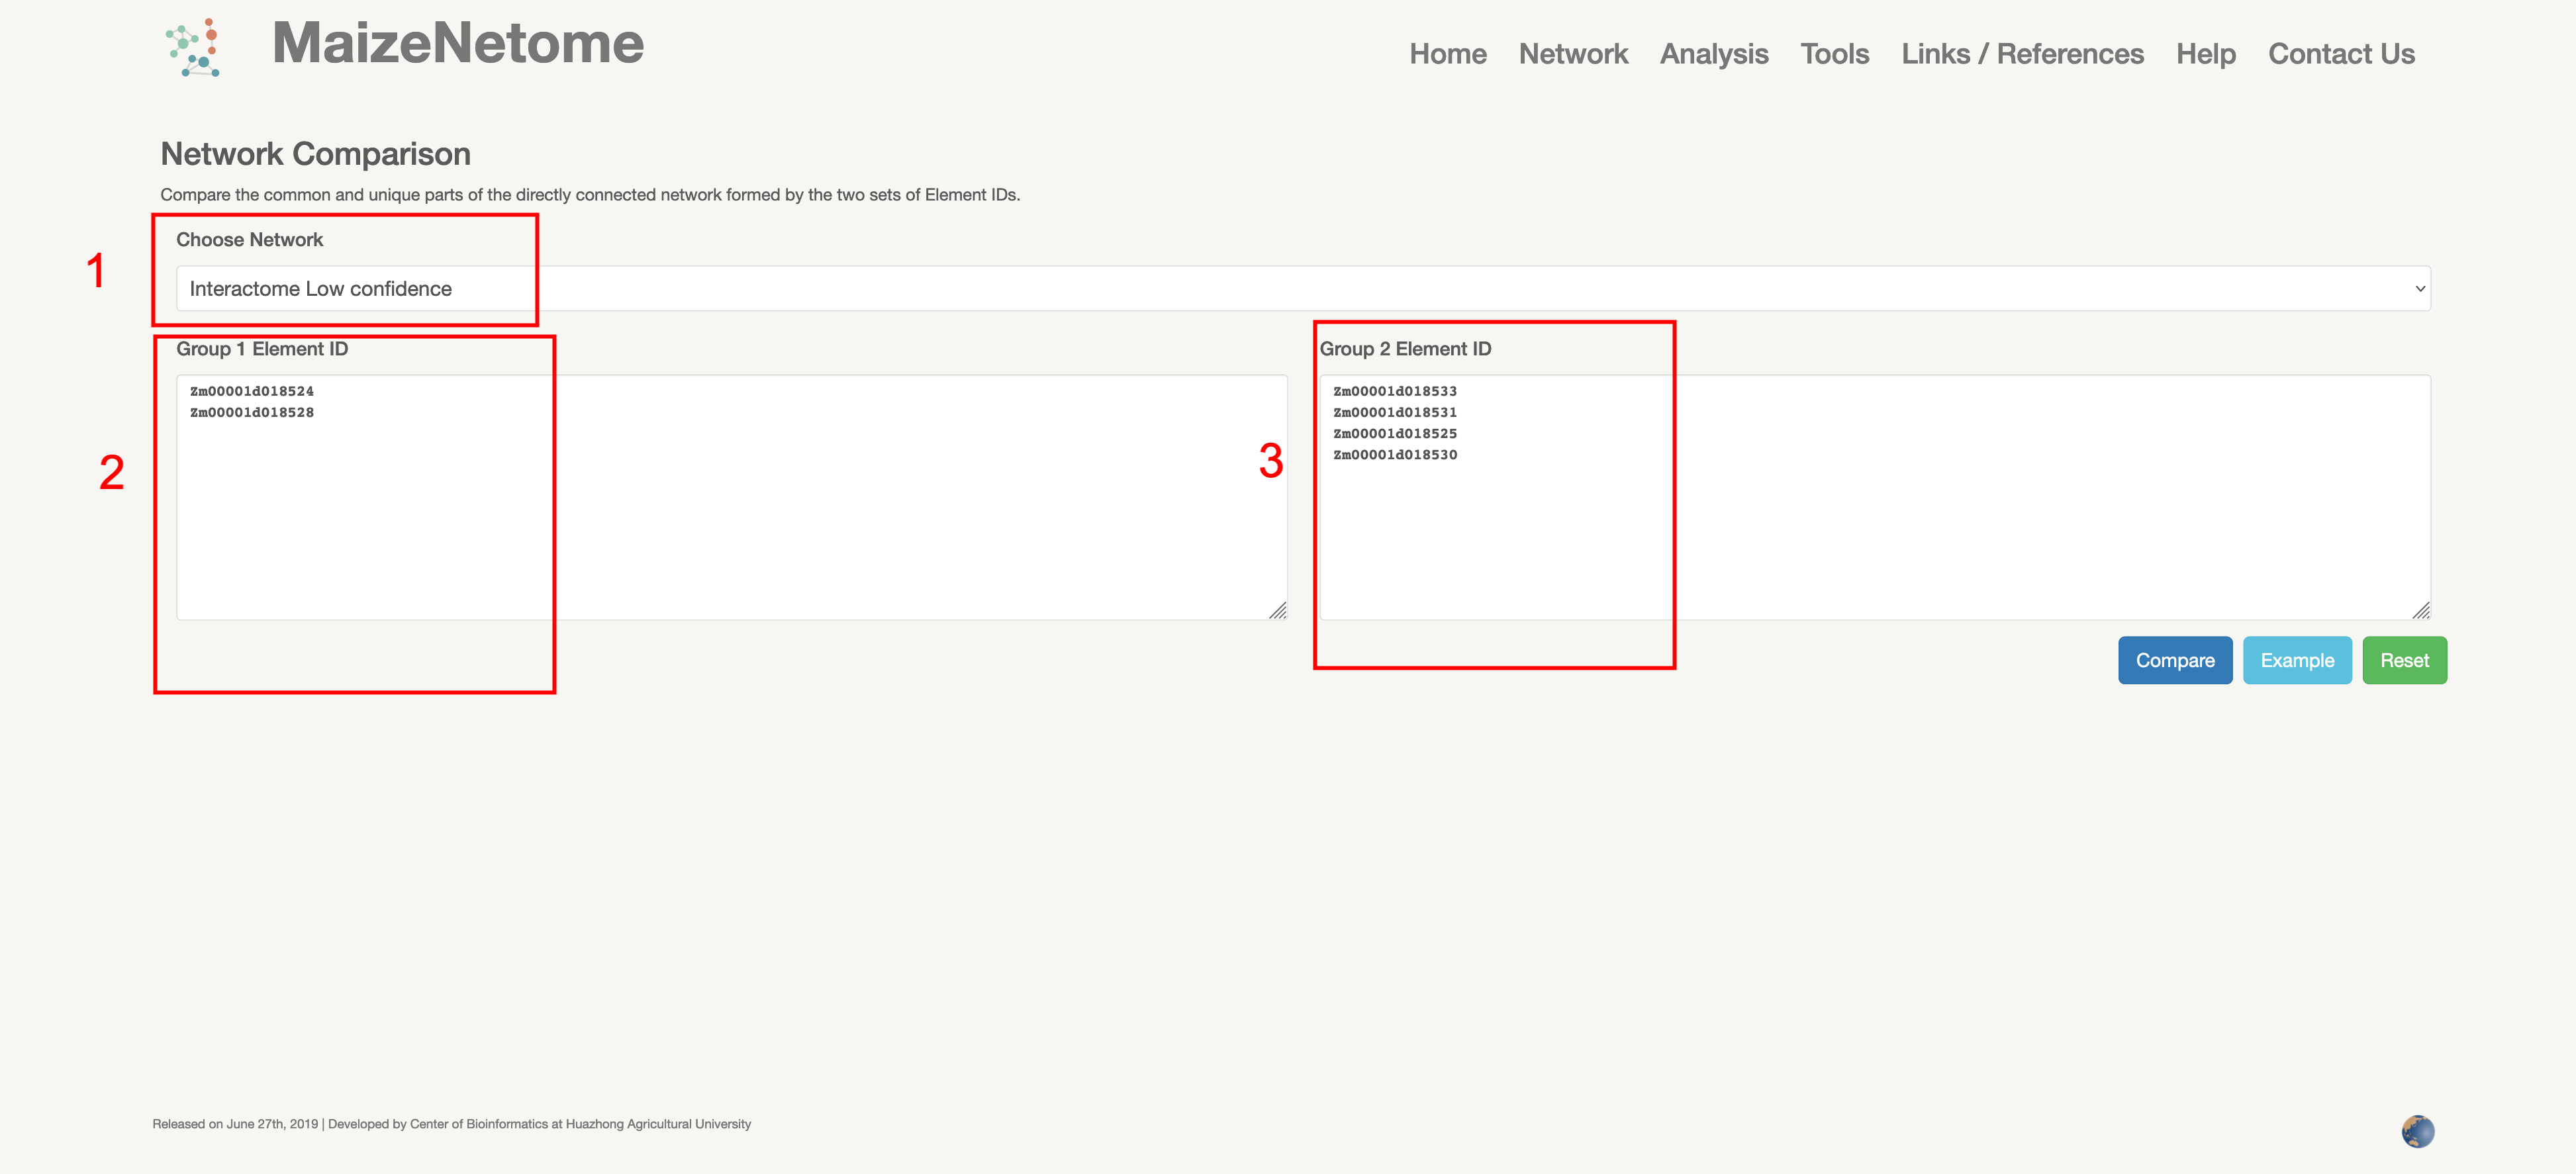
Compare the common and unique parts of the directly connected network formed by the two sets of Element IDs. As with Network Creation, try not to enter too many nodes. The result is a CSV file that provides node and edge information. The node file indicates whether the network is common or unique.
1. Red box 1: Users can choose network type. 2. Red boxes 2 and 3: Input boxes for 2 sets of elements of interest.
5.1 What is the naming rule for Element ID?
The naming rule is based on the version4 annotated file. For the mRNA locus annotation, if it is a V4 locus or has a large overlap, the V4 ID is used. If two or more V4 genes are crossed, it is considered to be a new gene. Named according to ZmmRNA000001, ZmmRNA000002.... For lncRNA, if V4 annotates it, then uses the V4 number, while if it is a new site, then ZmLnc000001, ZmLnc000002... will be named; all circular transcript, sRNA, fusion transcript are new comment numbers, named ZmCirc000001, ZmCirc000002...; ZmsRNA000001, ZmsRNA000002...; ZmFusionR000001, ZmFusionR000002... respectively.
5.2 How to choose the type of network when analyzing data?
The 3D data was obtained from the chia-pet experiment, so the interaction pairs obtained were usually close to each other in the genome; the transcriptome and the translatome were constructed based on the correlation of the expression levels of more than 20 tissues; PPI is the physical interaction detected by yeast double hybrids. The edge of the integrated network is at least one omics that has that edge. Transcriptome network contains the complete component interaction information. Due to the excessive amount of sRNA (~14w), it may affect the network structure. So we constructed the transcriptome without siRNAs, in this network replacing sRNA with microRNA precursor annotated in version4 annotated file. This network is effective for discovering the potential functions of non-coding RNA. All the nodes in the slim-transcriptome network are annotated by version4 annotated file. It is more suitable for the GO enrichment analysis based on annotated genes.
5.3 How to complete an element network-based functional prediction?
For predicting the function of an element component, such as lncRNA, circRNA, etc., you can first retrieve the directly connected network and then do GO or KEGG enrichment analysis to see the possible functions.
5.4 How to choose confidence?
The high, middle, and low confidence have been subjected to a certain threshold screening, and the low confidence network includes all the high confidence edge interactions.